Stable Audio 3 Small on an RTX 3050 6 GB — measured latency, per stage
Written 2026-09-14; rewritten 2026-09-15 around measurements. Target machine is victoria: NVIDIA GeForce RTX 3050 6 GB Laptop GPU (GA107, compute capability 8.6, 6144 MiB VRAM), 7.5 GB host RAM. It is the machine behind the Whistle runtime analysis and the Chatterbox V3 profiling pass.
Stable Audio 3 Small is a 433 M-parameter latent flow-matching transformer over a 4096× downsample autoencoder. It produces 120 s of 44.1 kHz stereo in 8 sampling steps. Measured here: 120 s of audio in 4.18 s cold and 2.16 s warm — 12.8× and 53× faster than real time respectively — at a flat 2179 MiB peak.
Everything below is tagged:
- measured — a number produced by running on victoria, with the harness named.
- derived — computed from measured or shipped values, formula shown inline.
- vendor-doc — read out of a released config, a line of source, or Stability's own benchmark table. Not re-measured here.
Nothing is presented as measured that was not. Where an earlier analytic pass and the measurements disagree, the measurements win, and two cases where the analytic model was structurally wrong are called out.
Measured: end to end
Harness hummingbird/scripts/generate.py. Model
small-music, prompt a Ludwig Göransson-style orchestral
cue, seed 20260915, steps=8,
cfg_scale=1.0. Environment: stable-audio-3
installed editable from the upstream checkout, running on torch
2.13.0+cu130 / torchaudio 2.11.0+cu130, driver
580.119.02. The library pins torch==2.7.1;
that pin could not be installed on this box because its
nvidia-cuda-* dependency chain failed to download, so a
pre-existing 2.13 build was reused.
| duration | generate | audio | RTF | peak VRAM | status |
|---|---|---|---|---|---|
| 5 s | 2.07 s | 5.00 s | 0.414 | 2179 MiB | ok |
| 30 s | 2.54 s | 30.00 s | 0.0845 | 2179 MiB | ok |
| 60 s | 2.78 s | 60.00 s | 0.0464 | 2179 MiB | ok |
| 120 s | 4.18 s | 120.00 s | 0.0348 | 2179 MiB | ok |
Model load was a near-constant 9.6–11.4 s and is excluded from the generate column. Least-squares fit over the four points:
generate_seconds ≈ 1.92 + 0.01805 × duration_secondsA fit on the 5/30/60 s points alone predicts 4.09 s for 120 s against 4.18 s measured — within 2 %, so the relationship is genuinely linear across the whole supported range.
Three things this establishes, in order of how much they change the picture:
A ~1.92 s fixed cost per generate() call that
the roofline model omitted entirely. Duration buys almost
nothing: latency is dominated by a constant term, not by per-latent
work. At 5 s the fitted line already predicts 2.01 s, and 2.07 s was
measured — the constant and the slope together account for both. Any
latency model for this family needs a constant, and the previously
published estimate of "0.6–1.3 s for 30 s" was not merely imprecise, it
was structurally wrong because it attributed all cost to duration.
The per-stage profile below identifies that constant: it is the
text encoder's first call in a fresh process, and it is 100–200× cheaper
on every subsequent call.
The analytic band was wrong in the optimistic direction, not the pessimistic one. It predicted 1.9–3.8 s for 120 s (RTF 0.016–0.032). The measurement is 4.18 s, i.e. 1.1–2.2× slower than the band; at 30 s it is 2.54 s against a predicted 0.6–1.3 s. The cause is the missing constant term: the roofline had no way to represent cost that does not scale with output length.
Peak VRAM is 2179 MiB and identical at every duration from 5 s to 120 s. This is a flat line, and it is the strongest available confirmation that resident cost is weights plus a fixed workspace while duration is nearly free. It also matches the derived 1.65 GB fp16 weight sum plus a ~0.5 GB context/workspace allowance. Only 35 % of the card is used, so "will it fit" was never close on this GPU, and the 4 GB variant would likely pass with room to spare.
Per-stage and per-module latency
Harness hummingbird/scripts/prof.py, which wraps the
reference library's own modules from the outside (a CUDA event pair
straddling each stage, resolved after
torch.cuda.synchronize()) so nothing under
refs/ is modified. Same prompt, seed, steps=8,
cfg_scale=1.0 as above. Each configuration is run
three times in one process: call 1 is the cold path a
first request takes, calls 2–3 are the steady state.
conditioning is the T5Gemma text encoder plus the
multi-conditioner; dit_forward is the diffusion transformer
across all 8 sampling steps; decode is the SAME-S decoder;
postprocess is the fp32 → clamp → int16 → host
transfer.
Cold versus warm — this is the whole story
| duration | call | generate | conditioning | DiT (8 steps) | decode | postproc | unaccounted |
|---|---|---|---|---|---|---|---|
| 5 s | 1 | 1.908 | 1.354 | 0.453 | 0.076 | 0.003 | 0.023 |
| 5 s | 2 | 0.316 | 0.010 | 0.253 | 0.050 | 0.001 | 0.002 |
| 30 s | 1 | 2.408 | 1.449 | 0.692 | 0.241 | 0.010 | 0.015 |
| 30 s | 2 | 0.715 | 0.011 | 0.491 | 0.210 | 0.006 | −0.003 |
| 60 s | 1 | 3.721 | 2.134 | 1.099 | 0.450 | 0.047 | −0.009 |
| 60 s | 2 | 1.471 | 0.021 | 0.984 | 0.457 | 0.030 | −0.015 |
| 120 s | 1 | 3.828 | 1.425 | 1.611 | 0.765 | 0.047 | −0.020 |
| 120 s | 2 | 2.164 | 0.011 | 1.414 | 0.734 | 0.043 | −0.037 |
The ~1.92 s fixed cost is the text encoder's first
call. conditioning costs 1.35–2.13 s
cold and 10–21 ms warm — a factor of 100–200×.
Every generate.py run in the table at the top of this
article was a fresh process, so all four of its measurements paid that
cost, and the fitted intercept of 1.92 s is almost exactly its mean. The
constant was never an inherent property of the model; it was a
cold-start artifact that the per-process harness could not see.
Subtracting it, the two regimes are both clean linear fits over the canonical durations:
cold:  generate = 2.042 + 0.01719 × duration     R² = 0.79
warm:  generate = 0.290 + 0.01631 × duration     R² = 0.97
The slope barely moves (17.2 → 16.3 ms per audio-second). All of the improvement is in the constant: 2.04 s → 0.29 s. The warm fit's residual structure is one outlier at 60 s; on the other three points it is within 0.08 s.
Reconstructing cold 120 s from its parts,
1.41 + 0.73 + 0.043 + 0.011 + 1.41 (warm DiT + decode +
postproc + warm conditioning + cold conditioning premium) = 3.60 s
against 3.83 s measured. The budget closes.
Steady-state RTF is 0.0187 at 120 s, not 0.0348 — 53× real time rather than 29×. The published figure is a cold-start figure, and any comparison against it should say which regime it is in.
The latency budget, ranked
Everything below is steady state at 120 s, one warm request, 2.171 s total, GPU clock already ramped and no other client on the card. Two views of the same measurement: what the stage costs, and what the hardware component underneath it costs.
By stage:
| rank | stage | seconds | share | underlying hardware work |
|---|---|---|---|---|
| 1 | DiT — 8 steps × 20 blocks | 1.414 | 65.3 % | 2,952 tensor-core GEMMs; 320 + 336 large tile-shape calls; 320 flash-attention kernels |
| 2 | SAME-S decoder | 0.734 | 33.9 % | 14 sequential chunk passes; 3166 elementwise, 1218 copy, 168 large GEMM, 84 fused GEMM+ReLU |
| 3 | post-process: fp32 → clamp → int16 → host | 0.043 | 2.0 % | one DtoH transfer of 5.29 M samples |
| 4 | text encoder (warm) | 0.011 | 0.5 % | 96 bf16 GEMM + attention kernels, 8.2 ms device |
| — | unaccounted | −0.037 | −1.7 % | sampling-loop host work falling inside the DiT window |
By component, inside the two stages that matter:
| rank | component | stage | device ms | share of its stage | calls | mean |
|---|---|---|---|---|---|---|
| 1 | GEMM 160x128x32 tile |
DiT | 343.0 | 24.8 % | 320 | 1,072 µs |
| 2 | elementwise | decoder | 244.5 | 33.3 % | 3,166 | 77 µs |
| 3 | elementwise | DiT | 246.5 | 17.8 % | 6,208 | 40 µs |
| 4 | GEMM 160x128x32 tile |
decoder | 186.7 | 25.4 % | 168 | 1,111 µs |
| 5 | GEMM 192x128x32 tile |
DiT | 186.0 | 13.5 % | 336 | 554 µs |
| 6 | copy | DiT | 154.1 | 11.1 % | 3,256 | 47 µs |
| 7 | copy | decoder | 120.3 | 16.4 % | 1,218 | 99 µs |
| 8 | flash attention | DiT | 116.9 | 8.5 % | 320 | 365 µs |
| 9 | ampere_fp16 128x128 |
DiT | 99.6 | 7.2 % | 480 | 207 µs |
| 10 | layer_norm (fp16 + fp32) | DiT | 117.0 | 8.5 % | 1,120 | 100–110 µs |
| 11 | fused GEMM+ReLU | decoder | 46.5 | 6.3 % | 84 | 554 µs |
| 12 | flash attention | decoder | 42.7 | 5.8 % | 168 | 254 µs |
The single most important observation from these two tables:
the decoder and the DiT run the same large GEMM kernel. The
160x128x32 tile shape is the largest single kernel in
both stages — 343.0 ms in the DiT and 186.7 ms in the decoder,
529.6 ms and 24.9 % of all device time between them.
The decoder is not a different kind of work; it is the same kind of work
invoked 14 times in a row on small slices.
Three things that are not bottlenecks at 120 s, all measured:
| candidate | measured cost | verdict |
|---|---|---|
| weight streaming (866 MB fp16 per step) | 54 ms over 8 steps | 3.8 % of the DiT stage; bandwidth-bound work is not the limit |
| attention | 116.9 + 42.7 ms | 8.5 % of the DiT and 5.8 % of the decoder; 12 % of FLOPs at the model ceiling |
| host-side kernel launch | 486 ms (decoder), 1,034 ms (DiT) | large in absolute terms, but the GPU is 99.4 % busy across the same windows, so the queue is absorbed — launch count is a symptom of the kernel mix, not a separate bottleneck |
And one that is a bottleneck only in a specific regime:
| candidate | condition | measured cost |
|---|---|---|
| text encoder, first call in a process | cold only | 1.4–2.1 s, against 11.9 ms warm |
That last row is a 100–200× swing, and it is a host-side stall rather than slow arithmetic — see the cold encoder trace. A service that keeps a process warm never pays it; a CLI invocation pays it on every run, and at 5 s of audio it is over 60 % of the wall time.
Where the warm time goes
At 120 s, the warm 2.164 s decomposes as:
| stage | seconds | share of generate |
|---|---|---|
| DiT — 8 steps × 20 blocks | 1.414 | 65.3 % |
| SAME-S decoder | 0.734 | 33.9 % |
| post-process (fp32 → int16 → host) | 0.043 | 2.0 % |
| text conditioning (warm) | 0.011 | 0.5 % |
| unaccounted | −0.037 | −1.7 % |
Two stages are 99 % of the request. The text encoder — which
dominates the cold path — is free once warm, and
post-processing is 43 ms for 120 s of stereo audio. The unaccounted term
is negative by 1.7 %, which is the sampling loop's own host work
(per-step schedule indexing, a torch.ones allocation, and
the noise draw) falling inside the measured DiT window; the stages are
not perfectly disjoint. The same decomposition closes at 30 s to within
0.4 %.
Both dominant stages scale linearly with duration, and the decoder scales slightly faster:
warm DiT   = 0.233 + 0.01028 × duration     R² = 0.97
decode     = 0.041 + 0.00599 × duration     R² = 0.98
Decode is 20 % of DiT at 5 s and 52 % of it at 120 s, so the autoencoder becomes a first-class cost at long durations — the opposite of the "decoder is a rounding error" instinct.
Requests above 120 s are silently clipped, not
rejected. Asking for 240 s returns
audio_seconds = 120.001, and a 240 s run's DiT and decode
times are identical to the 120 s run's to within 2 % (1.428 vs 1.414 s,
0.736 vs 0.734 s) because no extra work happens. The 120 s ceiling in
the model table is enforced by truncation, so a caller that requests a
longer clip gets a plausible-looking shorter file rather than an error.
That is worth knowing before timing anything above the cap.
Inside the DiT: 20 blocks, and they are uniform
Hooking each of the 20 transformer blocks across all 8 steps gives 160 timed invocations per call. Mean time per block, warm:
| duration | per block | × 20 blocks = per step | × 8 steps (vs measured total) |
|---|---|---|---|
| 5 s | 1.42 ms | 28.4 ms | 0.227 s (0.254 s) |
| 30 s | 2.88 ms | 57.6 ms | 0.461 s (0.491 s) |
| 60 s | 5.55 ms | 111.0 ms | 0.888 s (0.984 s) |
| 120 s | 8.62 ms | 172.4 ms | 1.379 s (1.414 s) |
The blocks are flat: at 120 s every block lands between 8.62 and 8.72 ms (±0.6 %), and the same holds at 30 s (2.88–2.96 ms). There is no hot block and no pathological first layer to single out once warm. The block sum accounts for 97.6 % of the DiT total at 120 s, the remainder being the input/output projections and the timestep embedding.
Cold, this is not true. On call 1 the maximum block time is 17–22 ms against a mean of 1.5–8.7 ms — one block absorbing a one-time 17–22 ms cost, consistent with kernel autotuning on first execution. That is the DiT half of the warm-up penalty; the encoder is the other, much larger, half.
Per-step DiT latency from the trace
The block hooks give a mean; the Perfetto trace gives actual per-step
timings, because record_function brackets each
dit_forward call. At 120 s, warm, the eight steps are
uniform:
| step | wall | device | kernel slices |
|---|---|---|---|
| 1 | 176.1 ms | 173.7 | 1,704 |
| 2 | 174.8 | 173.7 | 1,704 |
| 3 | 174.8 | 173.7 | 1,704 |
| 4 | 174.8 | 173.7 | 1,704 |
| 5 | 174.8 | 173.7 | 1,704 |
| 6 | 174.8 | 173.7 | 1,704 |
| 7 | 174.8 | 173.7 | 1,704 |
| 8 | 174.8 | 173.7 | 1,704 |
Steps 1–8 agree to ±0.4 % and issue an identical 1,704 kernel slices each, which is the same conclusion the block hooks reach from a different direction: nothing inside the denoising loop varies by step. Device time per step (173.7 ms) is 99.4 % of its wall time, so the loop is not waiting on the host.
Measurement caveat. The trace contains
dit_forward ranges on two worker threads
(tids 7 and 19862), both running the full eight-step loop in overlapping
intervals. Naively summing all dit_forward ranges therefore
double-counts, and it is easy to mistake one thread's partially-observed
first range for a fast first step — reading tid 19862 alone shows a 67.6
ms step 1 with 675 slices against 174 ms for its steps 2–8, which looks
like a 2.6× warm-up advantage but is an artifact of where that range was
measured. The table above is tid 7, whose first range is complete. The
profiler runs a second thread here; whether that is a data-parallel path
in the library or an artifact of Kineto's per-thread attribution was not
established.
The step-count lever is small
At 30 s, steady state, steps=8 costs 0.715 s and
steps=4 costs 0.474 s — a saving of 0.24 s, or 34
%, not the 50 % the step count suggests. The reason is that
only the DiT shrinks: 0.491 → 0.264 s, while decode holds at 0.210 s and
the remaining 0.01 s of conditioning and post-processing does not move.
Decomposing the steady-state 30 s request,
0.491 + 0.210 + 0.006 + 0.011 = 0.718 s against 0.715 s
measured.
So halving the step count buys a third of the time, and it costs an
output-distribution change: because the sampler injects fresh noise at
every step, steps=4 is a different render rather than a
cheaper one, and the saving has to be bought with an audio A/B rather
than a latency number alone.
Traces
The figures below are Perfetto renders of an actual warm 120 s
request on victoria (and one cold 30 s request), captured with
torch.profiler and NVTX-labelled per stage. They are the
source of every per-kernel number in this article.
They come in two magnifications. The whole-run views show where time goes across a request; the deep zooms below each of them crop the trace to a sub-millisecond window and render only the GPU track, so individual kernel names and durations are legible. A 174 ms denoising step cannot be read at a glance any more than a 738 ms decode can — the zooms are the part that answers questions.
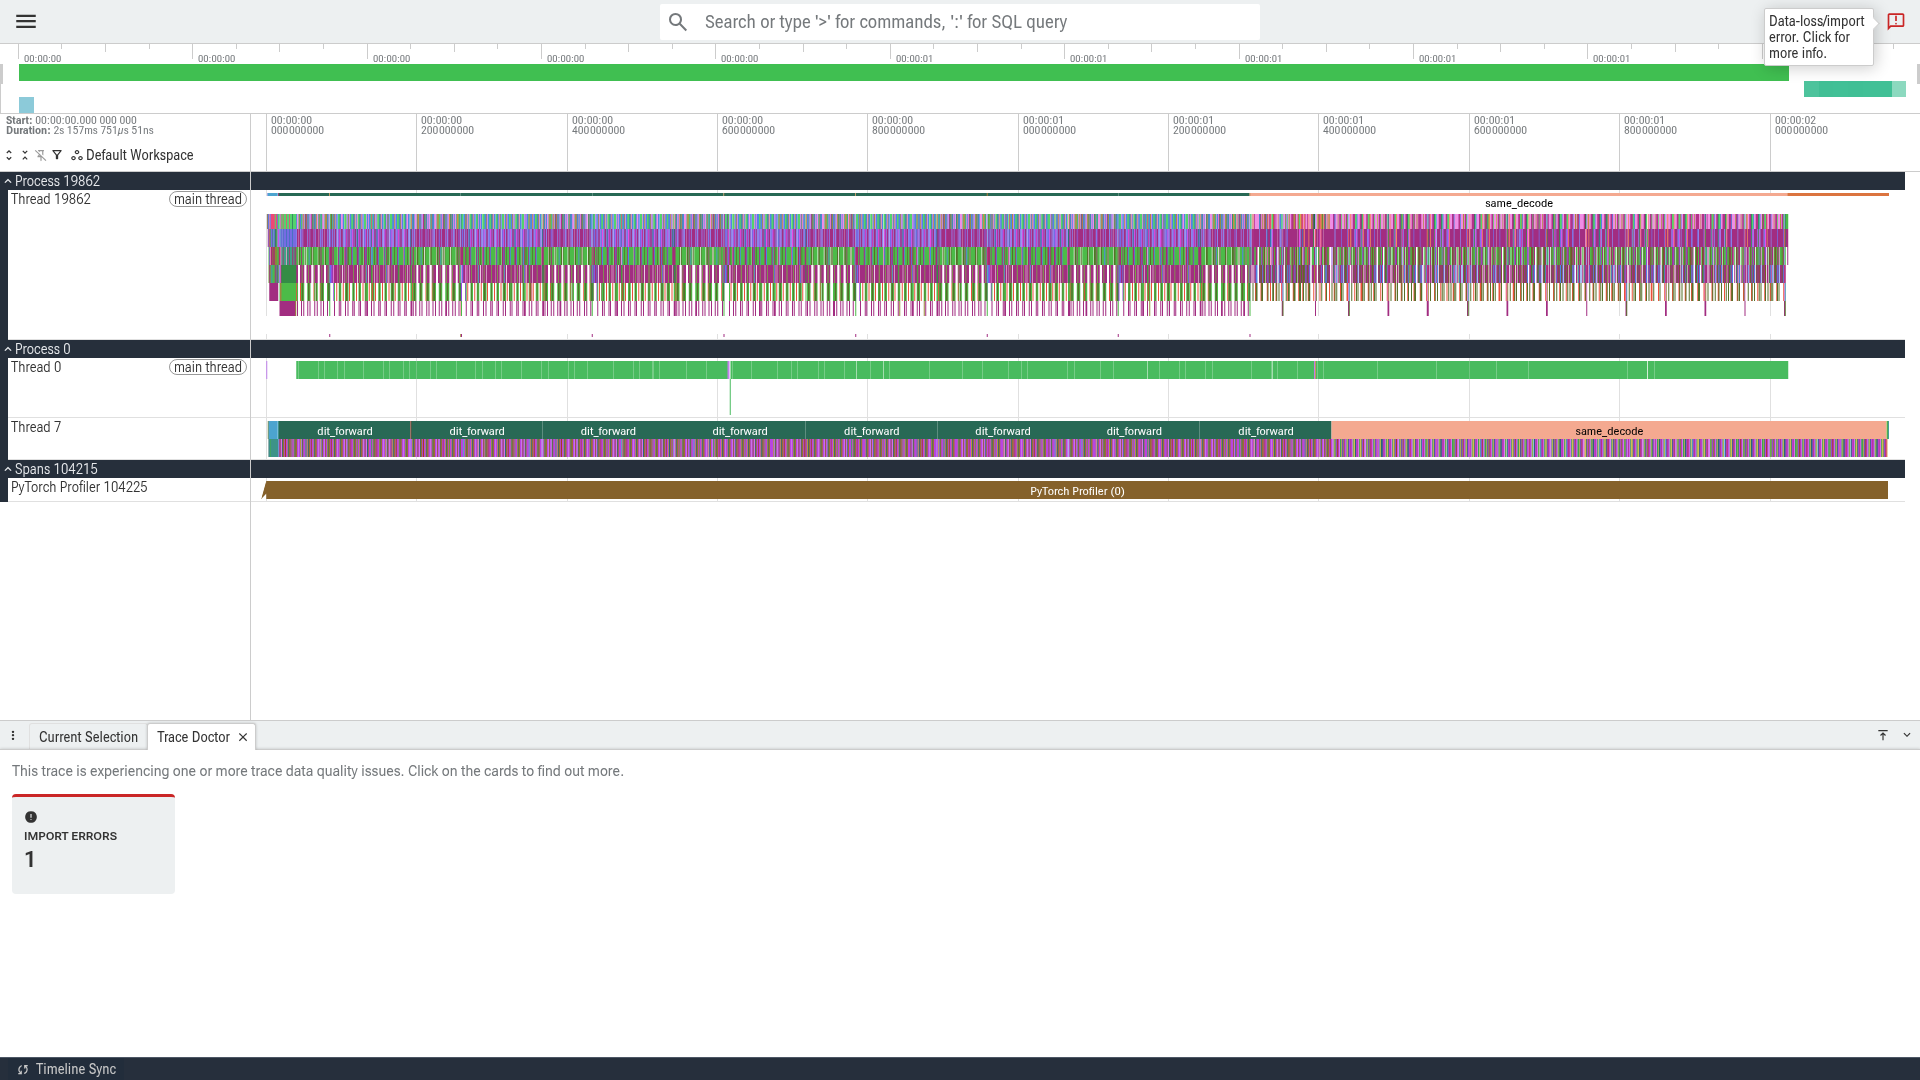
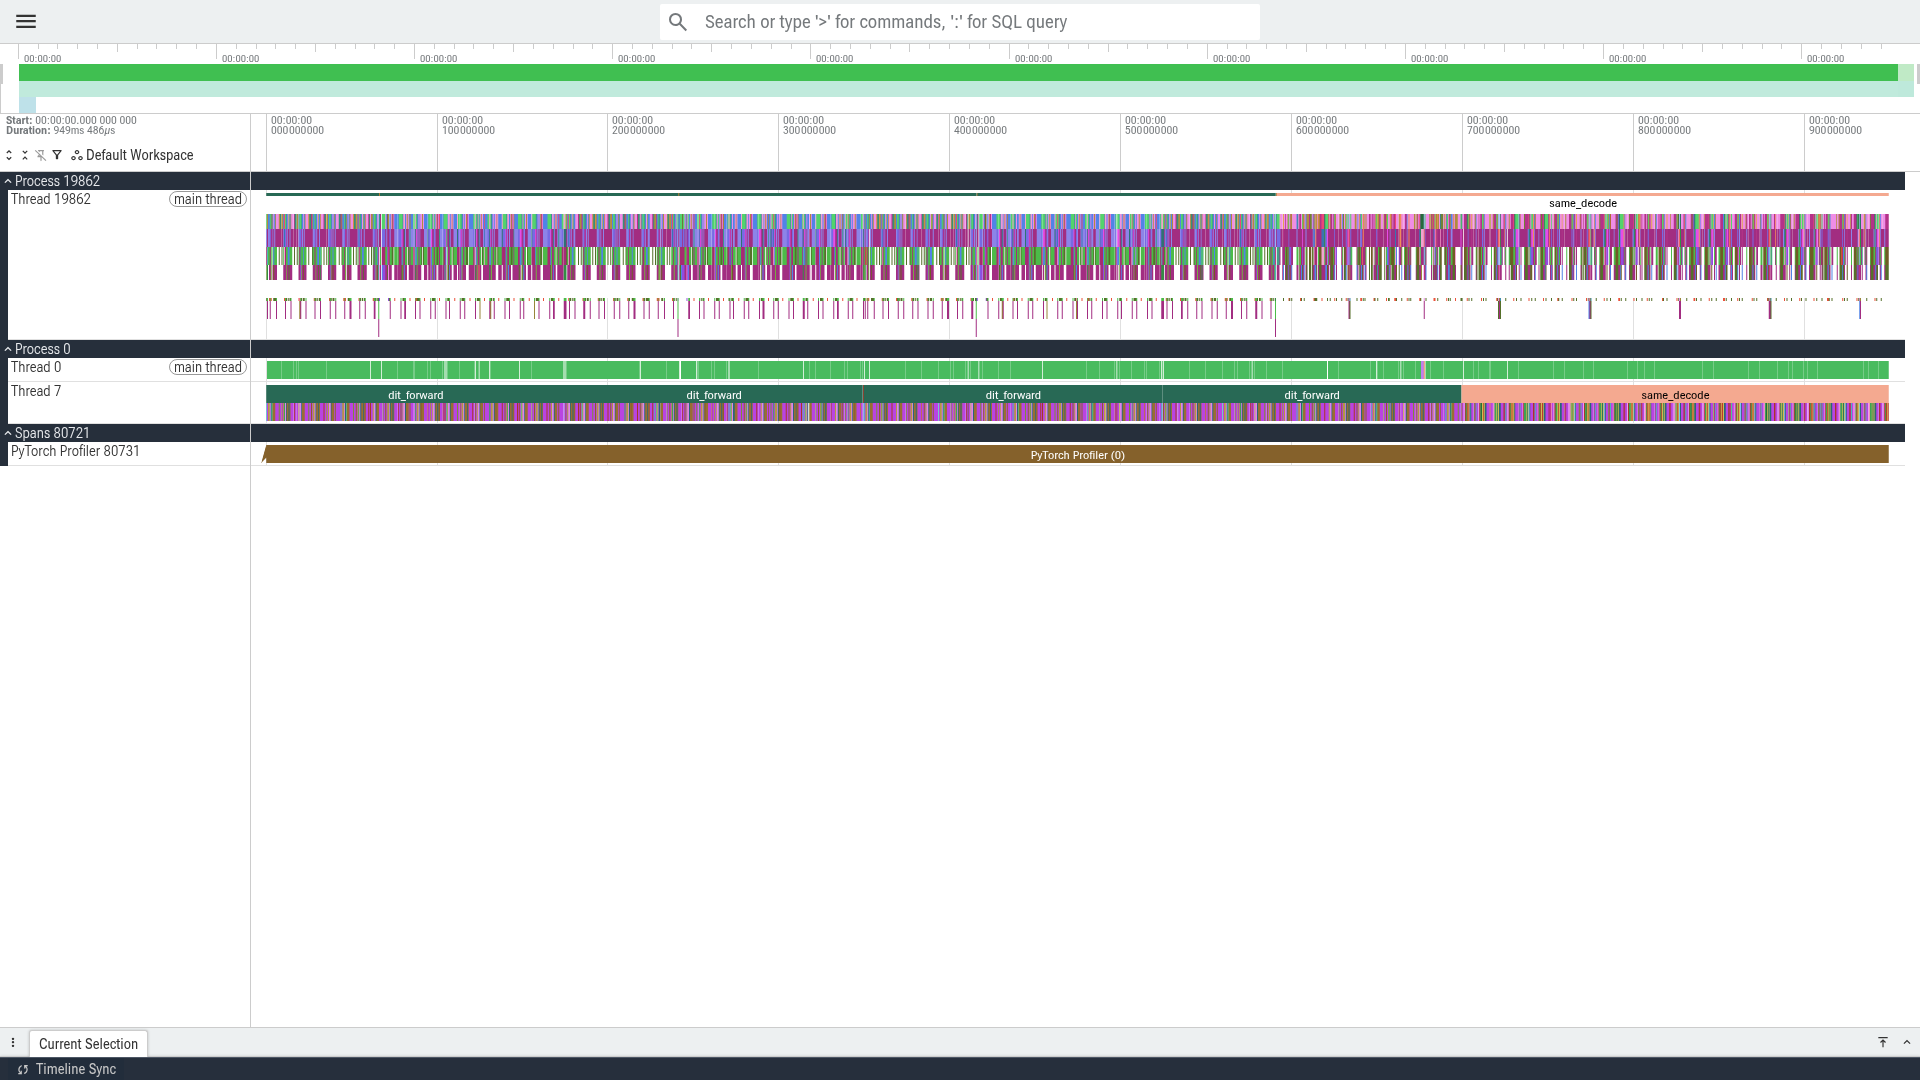
The whole request
Eight dit_forward passes run back to back, then a single
same_decode runs at the end and takes a disproportionate
share of the wall time.
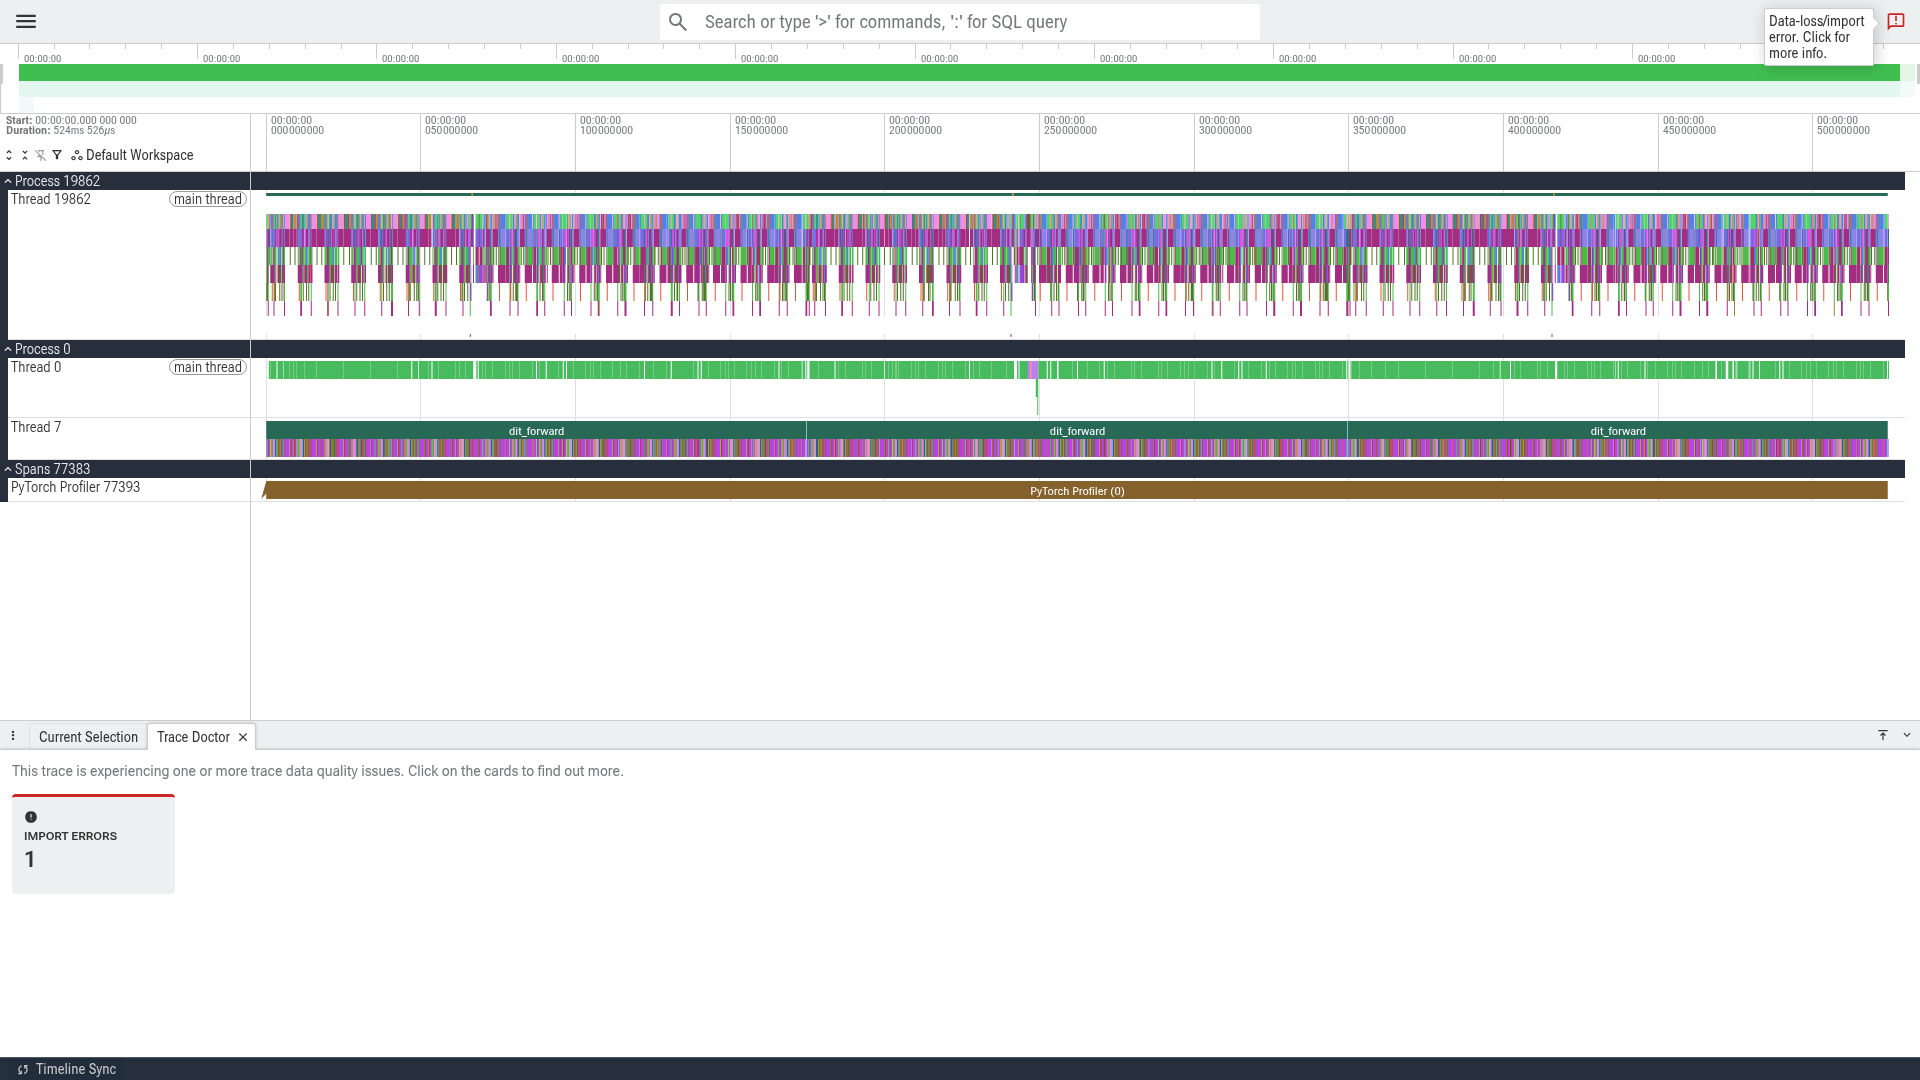
One denoising step
Zoomed to three consecutive dit_forward ranges. The
steps are byte-for-byte similar in shape and duration, which is why the
per-block hook reports a flat mean.
1 ms inside that step
One millisecond of the step, GPU track only. The repeating unit is
visible: a large GEMM, a flash_fwd attention kernel, then a
dense band of 1–2 µs elementwise kernels.

The GEMM and attention kernels
500 µs at higher magnification.
sm80_xmma_gemm_f16f16_f16f32 runs 1,085 µs on average
across the whole run; here it sits next to the short kernels that
surround it.

A single cutlass kernel
700 µs around a 104 µs
cutlass_80_tensorop_f16_s16816gemm — the largest single DiT
kernel in the step. The full kernel name is readable at this zoom.

The 1–2 µs tail
700 µs of the short-kernel tail. This band is why one DiT step issues 1,704 kernel slices while only a handful are large: the slice count is dominated by kernels that cost about a microsecond each.

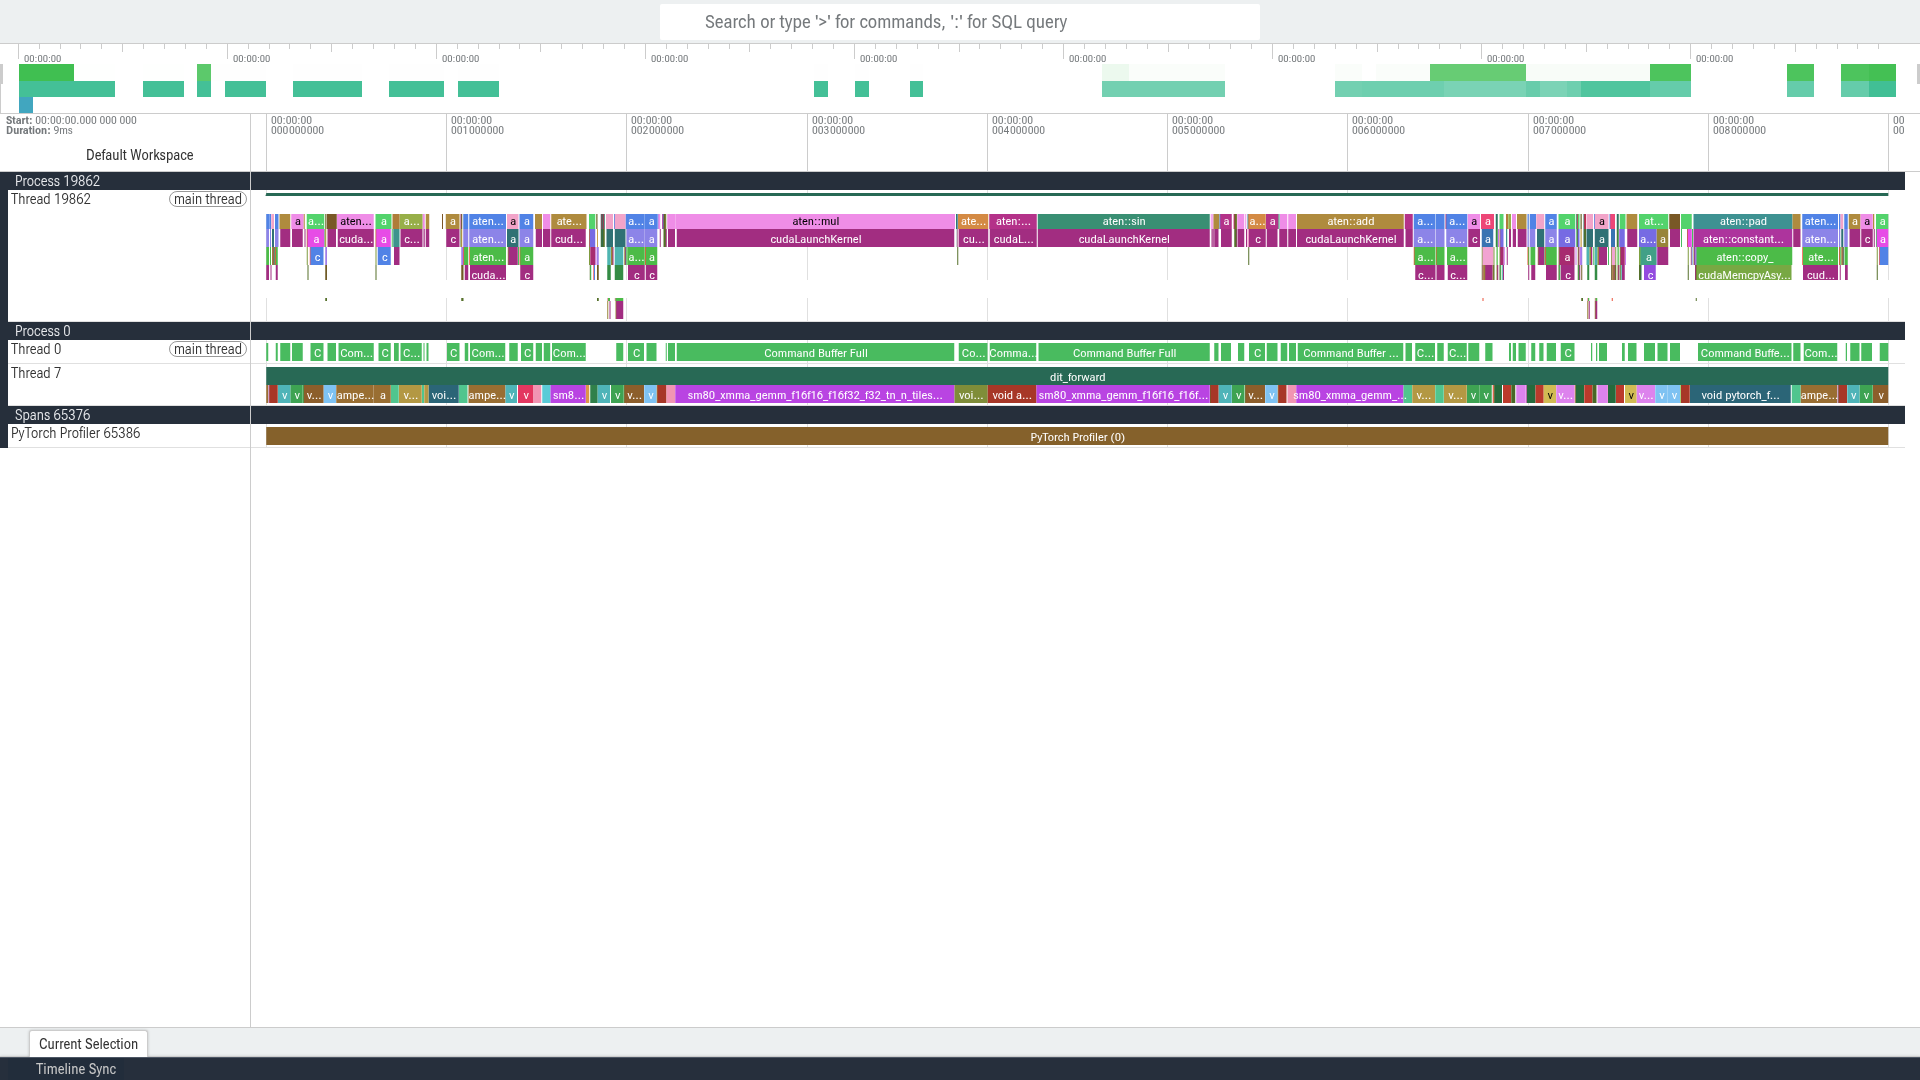
Inside one step
Nine milliseconds inside a single dit_forward, deep
enough to separate individual kernel slices. The 20 blocks produce a
dense, regular band of short kernels.
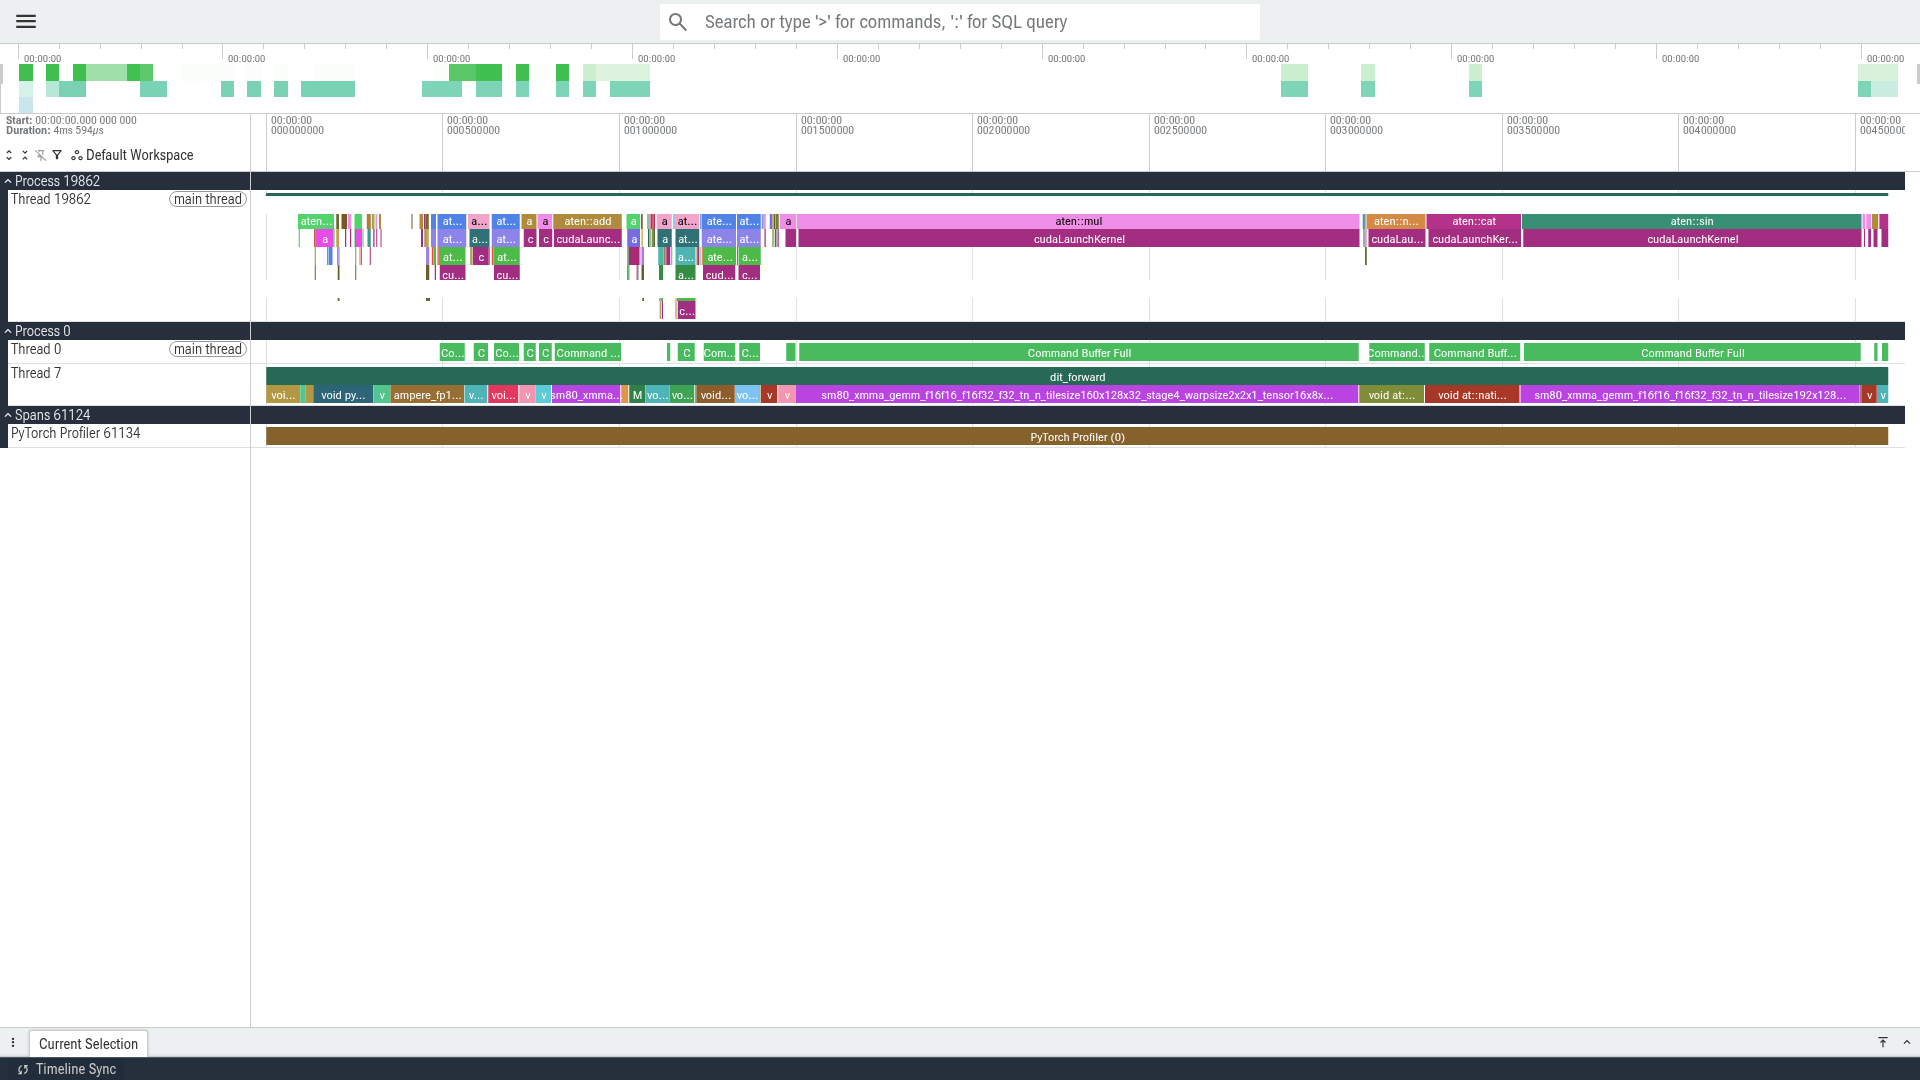
The dominant GEMM
The longest sm80_xmma_gemm_f16f16_f16f32 slice in the
trace, selected. This tile shape (160x128x32) is the single
largest kernel by total device time at 24.9 %.
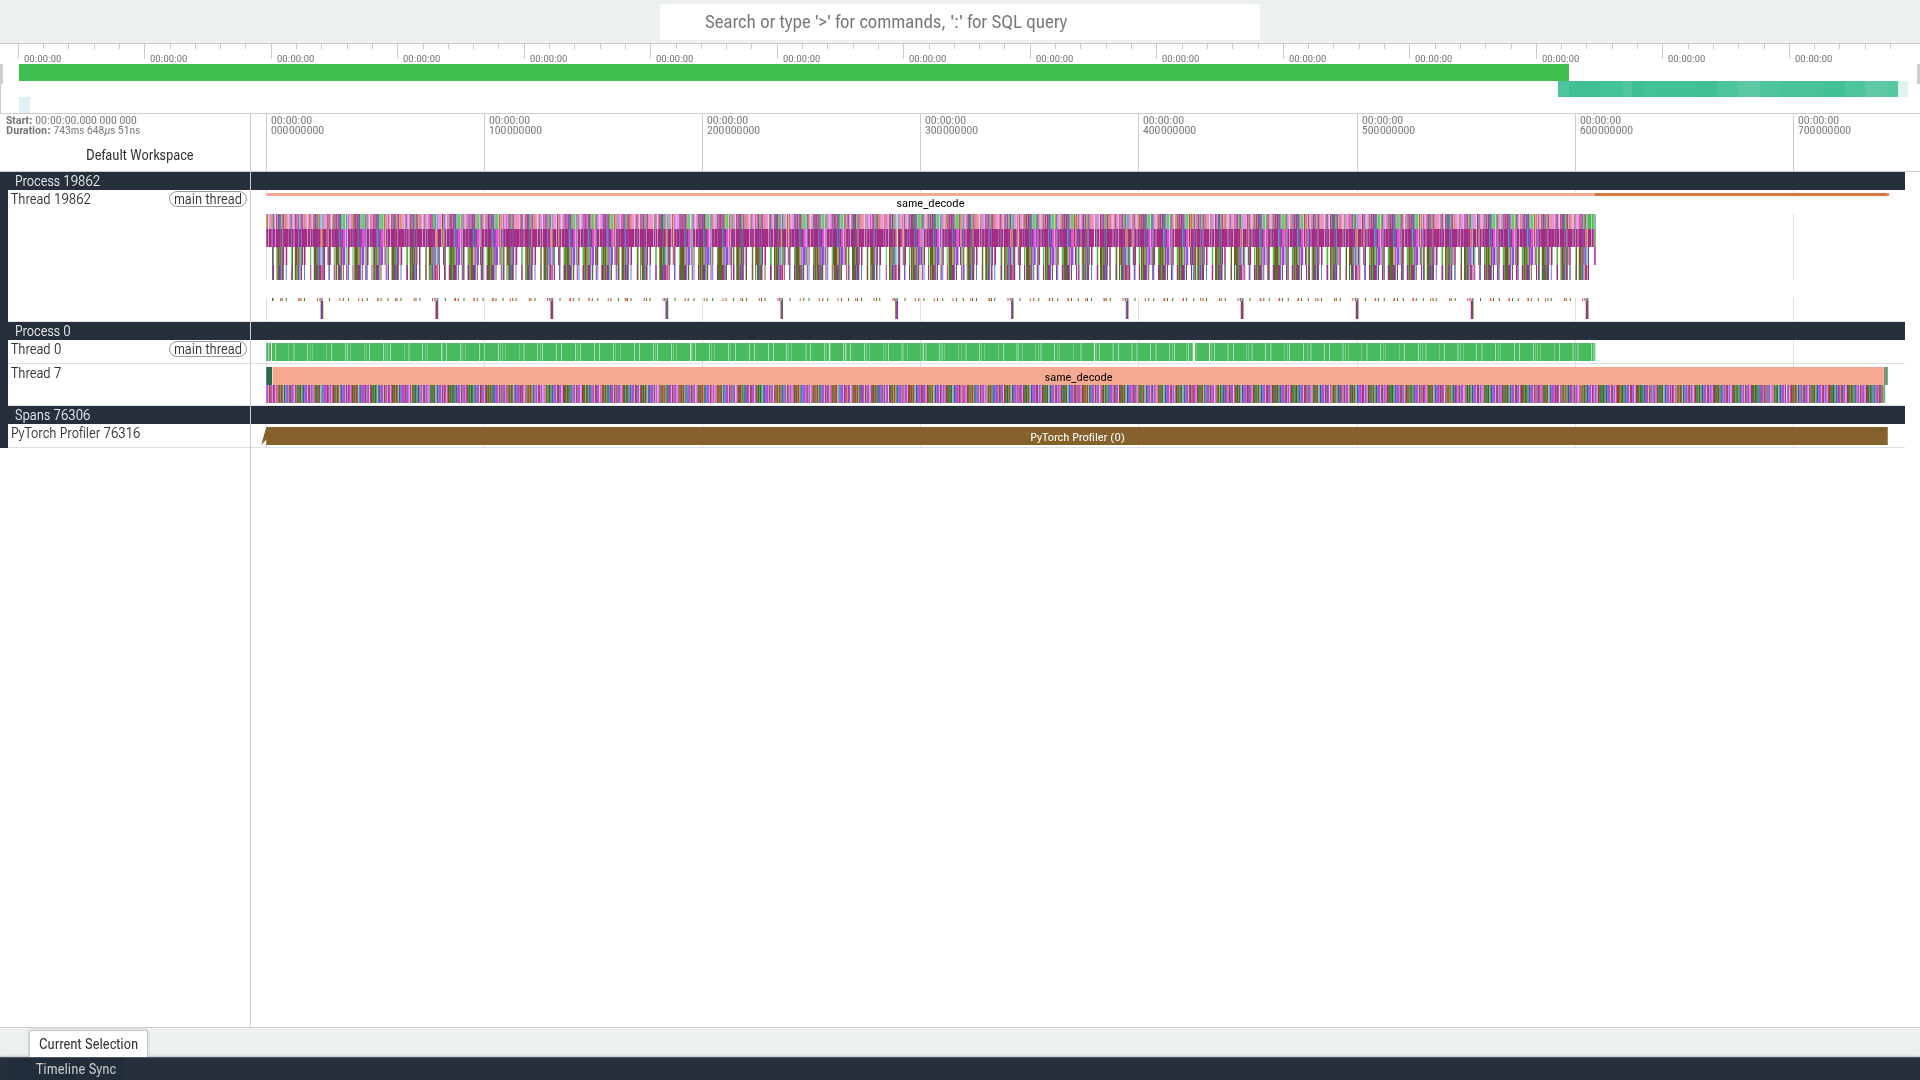
The decoder — the hotspot
The whole same_decode range at 120 s. It is
738.7 ms of wall time in one stretch, against 174.8 ms
for a single DiT step — larger than any individual denoising step and
33.9 % of the warm request.
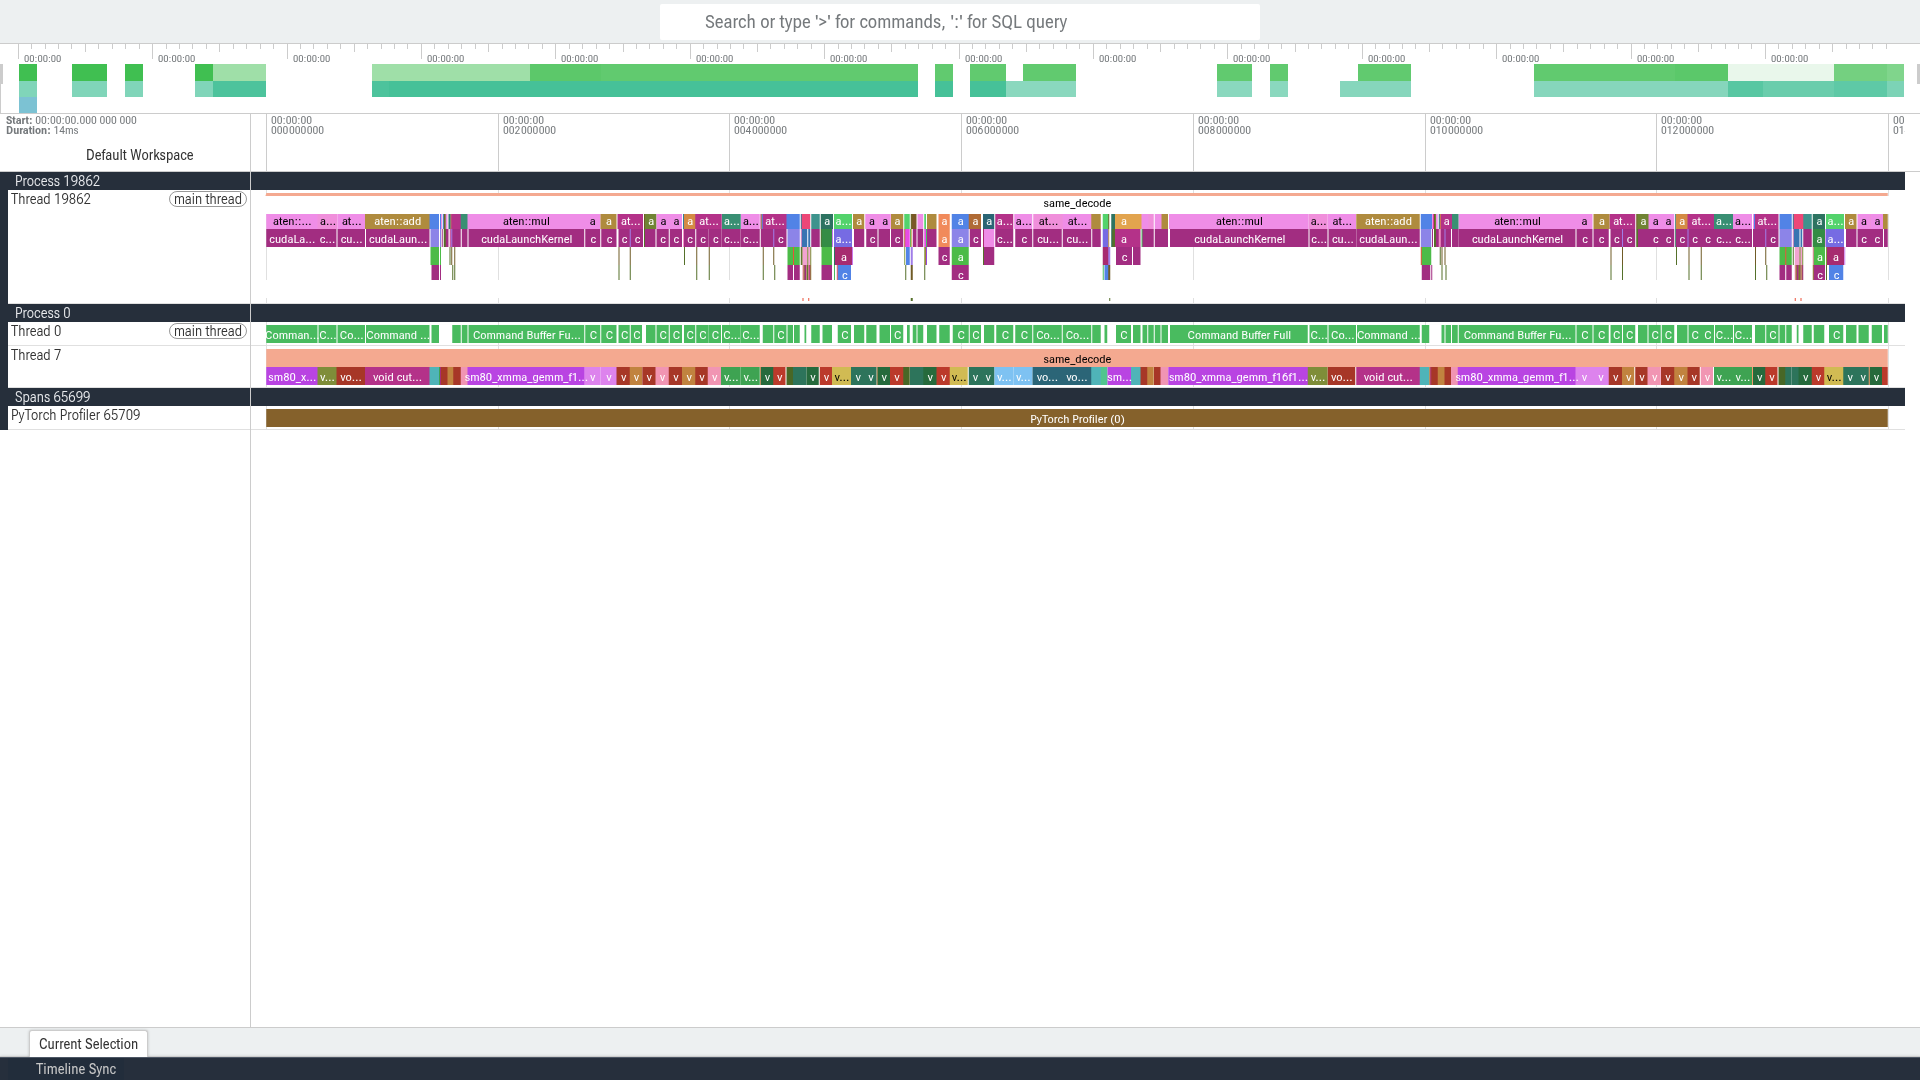
Inside the decoder
Fourteen milliseconds inside same_decode. The kernel mix
here is visibly dominated by short elementwise and copy slices rather
than the large GEMMs that dominate the DiT — the per-kernel signature of
the 58.9 % elementwise share in the table below.
500 µs of the decoder
Half a millisecond, GPU track only. The band is almost entirely
at::native:: elementwise work with a flash_fwd
kernel in the middle — no large GEMM in this window at all.

At a chunk boundary
400 µs at the start of a decode window, where one of the 14 chunk passes begins. This is the repetition that makes the decoder 14 sequential invocations rather than one: the same sequence restarts every 96 latent frames.

The decoder's large GEMM
700 µs around a 555 µs
cutlass_80_tensorop_f16_s16816gemm_relu_f16_128x256 kernel
— the largest single kernel inside the decoder, and only the
third-largest class share. Note the relu fused into the
GEMM epilogue.

The elementwise share, up close
700 µs of decoder elementwise, copy and normalisation kernels. Individually they are 40–270 µs; collectively they are 432.7 ms, the single largest share of the decoder's device time.

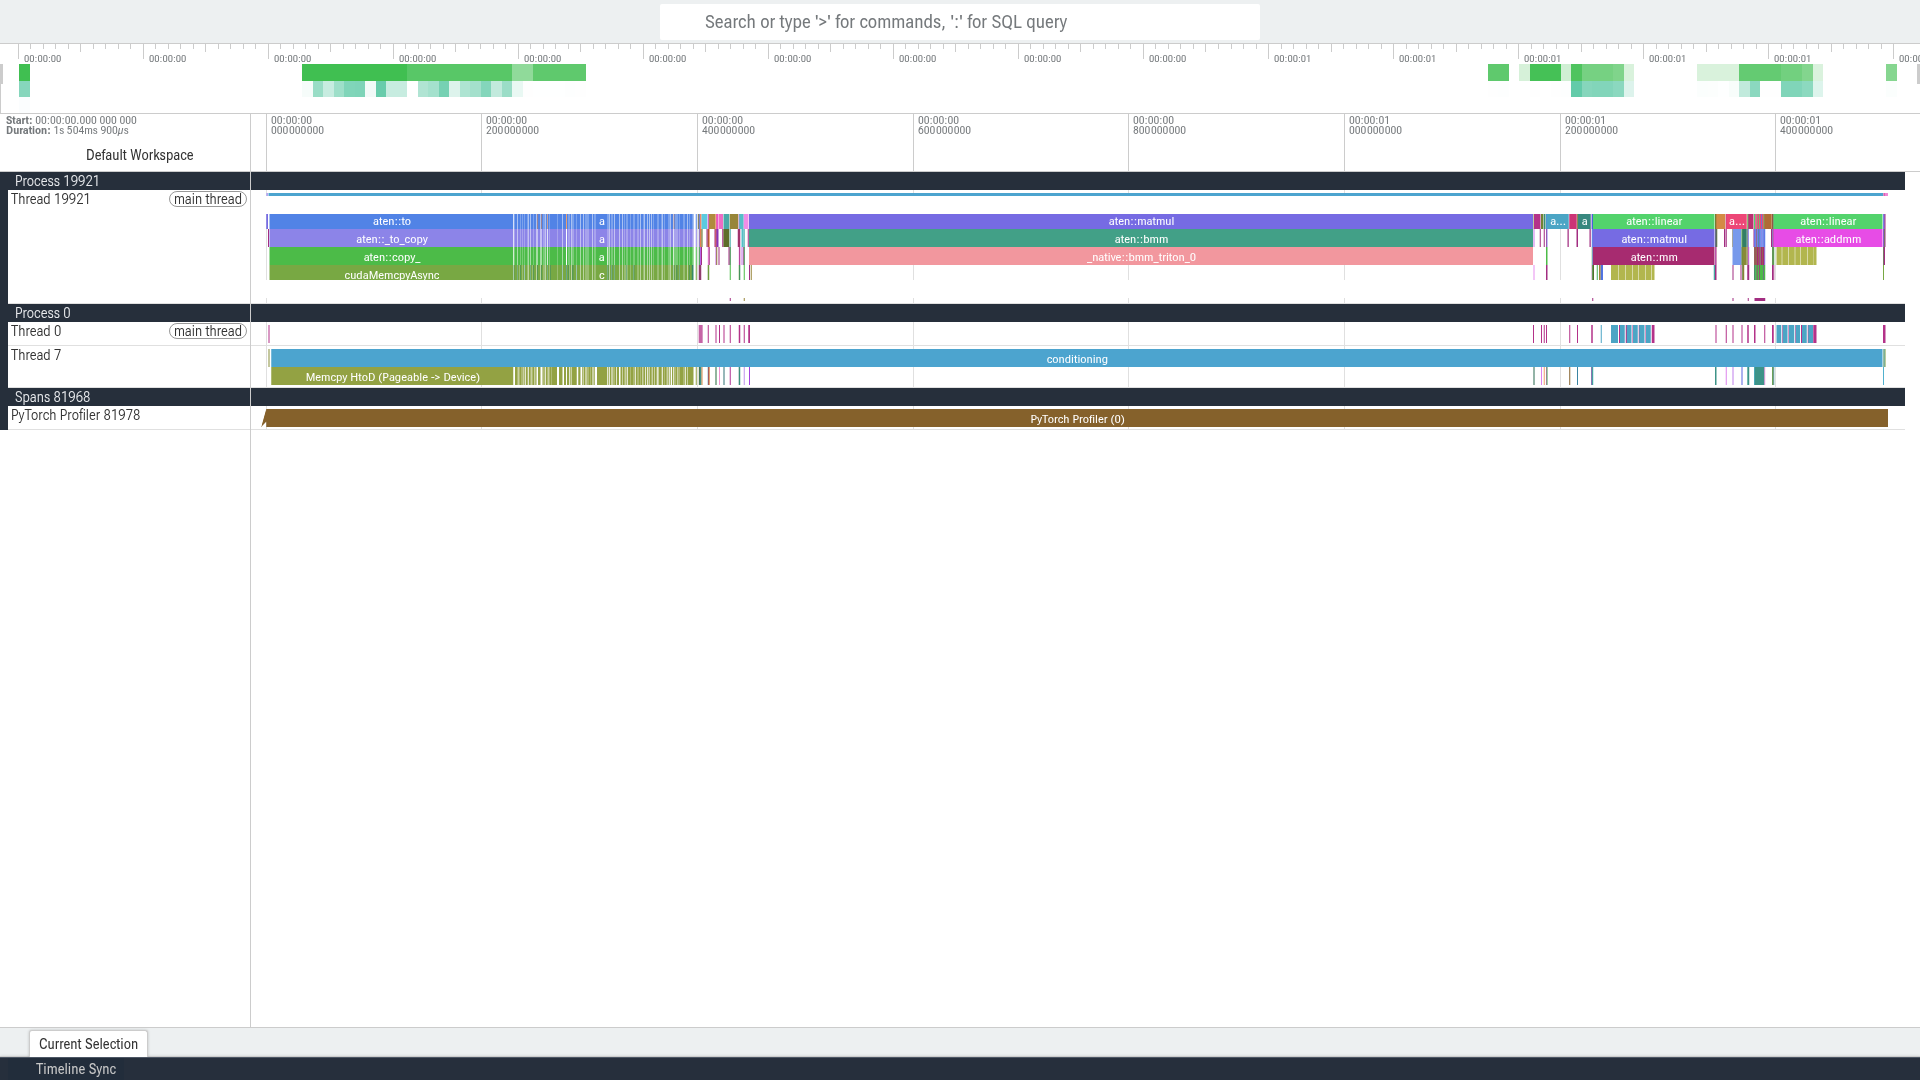
The cold text encoder
The conditioning range on the first
call in a fresh process. This is the 1.4–2.1 s cost that
generate.py paid on every run and that the fitted 1.92 s
constant corresponds to.
Cold, at 450 µs
450 µs inside the cold conditioning range, at the point
where its compute actually happens. The encoder's kernels are here:
ampere_bf16_s16816gemm_bf16 and
fmha_cutlassF_bf16 attention. The text encoder runs
bf16 even though the model loads fp16 — the trace is
unambiguous about it.
The timing is the striking part, and it is a stall rather than slow arithmetic. Of the range's 1,494.9 ms, the GPU issues kernels in two thin slivers and one burst:
offset within conditioning |
kernels | what |
|---|---|---|
| +396 to +500 ms | 37 | a few elementwise and reduce kernels |
| +1,000 to +1,300 ms | 18 | a few more |
| +1,300 to +1,400 ms | 799 | the encoder's actual compute |
| everything else | ~0 | the GPU is idle |
All 96 of the encoder's bf16 kernels land between +1,339 ms and +1,384 ms — about 45 ms of dense GPU work, arriving after more than a second in which the card is essentially unused. That is what the 1.4–2.1 s cold penalty is: not the encoder computing slowly, but the GPU waiting while the host prepares to use it. Warm calls skip the wait entirely, which is why the same kernel mix costs 11.9 ms.

Warm, at the same scale
The same 300 µs scale on the warm call, which reaches its bf16
kernels immediately: the warm encoder is 11.9 ms total against 1,425 ms
cold. The kernel shapes are the same
ampere_bf16_s16816gemm_bf16 work — the 120× difference is
entirely in when the GPU is allowed to start, not in the steady-state
kernel mix.

GPU stream occupancy
The GPU stream row across the last DiT steps and into the decode, showing launch density and the gaps between kernels.
Architecture in numbers
| component | parameters | role |
|---|---|---|
DiT (small) |
433 M | latent flow-matching denoiser, 20 blocks |
| T5Gemma-B-B-UL2 text encoder | 284 M | prompt conditioning, runs once per request |
| SAME-S autoencoder | 108.3 M | latent ↔︎ waveform; decoder is the vocoder |
DiT constants (vendor-doc, from the MLX port's
hard-coded sa3-sm-music block):
| constant | value |
|---|---|
IO_CHANNELS / EMBED_DIM |
256 / 1024 |
DEPTH / NUM_HEADS /
HEAD_DIM |
20 / 16 / 64 |
FF_INNER |
4096 |
NUM_MEMORY_TOKENS |
64 |
COND_TOKEN_DIM / GLOBAL_COND_DIM |
768 / 768 |
ROPE_DIMS |
32 |
The forward pass sees T = L + 64 tokens, where
L is the latent frame count and 64 is the memory-token
prefix shared across the batch.
Latent geometry: 4096 samples per channel per latent
frame, i.e. 44100 / 4096 = 10.7666 latent frames per
second (92.88 ms per frame). Three independent confirmations
agree: the TensorRT README bounds the DiT engine at "L=1..4096 = ~93 ms
.. ~6.3 min" (4096²/44100 = 380.4 s ✓); the autoencoder benchmark states
"L=8192 is 761 s" (8192 × 4096/44100 = 760.9 s ✓); and the SAME-S
decoder profile ceiling L=1292 is exactly 1292 × 4096/44100
= 120.0 s, the small model's maximum ✓.
Correction. The model overview claims "for a 10-second clip, 2 channels × 441k samples compresses down to 216×256". That is wrong by 2×: 10 s is 108 latent frames. The 216 figure divides the interleaved element count (2 × 441,000) by 4096, while the per-channel divisor is also 4096. Every attention and activation figure scales with the token count, so this matters.
| duration | latent frames L |
DiT tokens T = L + 64 |
|---|---|---|
| 5 s | 54 | 118 |
| 30 s | 323 | 387 |
| 120 s | 1292 | 1356 |
SAME-S is a separate, independently trained stereo
autoencoder — not a diffusion VAE and not fine-tuned with the DiT.
Vendor-doc from SAME-S/model_config.json:
latent_dim 256, downsampling_ratio
4096, a patched pretransform with
patch_size 256, and 6 transformer blocks
per side (independently confirmed by the fp16 build script, which counts
"24 instances total (6 layers × 4 norms/layer)" and "6 Cos + 6 Sin").
Two structural details drive the numerics later: its normalisation is
not RMSNorm but a tanh-bounded affine,
out = beta + gamma * tanh(alpha * x), and both sides use
differential attention — two softmax maps subtracted,
Sub(MatMul1(softmax1, v), MatMul3(softmax2, v)). SAME-S's
scheme is documented as "a workaround for sliding window attention on
CPU"; SAME-L uses real sliding-window attention and needs a GPU kernel
for it.
There are no conv-only or vocoder stages. The decoder is the vocoder: audio is patched to 512 channels at 1/256 rate, encoded 16× down to 256-dim latents at 1/4096 rate, and the decoder inverts that.
T5Gemma is an embedding-bandwidth problem, not a compute
problem. Derived from the shipped fp16 export:
t5gemma_f16.npz is 567.4 MB, so ≈ 284 M parameters. Those
are overwhelmingly a table: 768-wide with a ~256 k Gemma vocabulary
gives ≈ 197 M embedding parameters (69 % of the encoder), the rest in
~12 layers. It runs exactly once per prompt.
FLOP budget: attention is not the bottleneck
Derived from the confirmed dims. MACs per token per block, excluding
the text-side cross-attention K/V projection (computed on the short
context, not on T):
| term | MACs |
|---|---|
linear layers (self-attn QKV + out, cross-attn q + out, FFN up/down,
to_local_embed) |
20,186,112 |
self-attention QK^T + PV = 2·T·1024 |
2048·T |
Total per forward = 2 × 20 × T × (20,186,112 + 2048·T)
FLOPs. At the small model's 120 s ceiling, attention is 12
% of the FLOPs and the linear GEMMs are 88 %; at 30 s attention
is under 4 %.
Solving 2048·T = 20,186,112 puts the crossover at
T ≈ 9857, i.e. L ≈ 9793 latent frames ≈ 909 s
of audio — 7.6× beyond the small model's 120 s cap.
Quadratic attention is not a bottleneck for this model at any
duration it supports, and a 3050 owner should not spend effort on
attention kernels. (Full self-attention with no KV cache is
still why the model cannot be trivially chunked for memory; that is a
different problem, and chunked decoding is the mechanism that addresses
it.)
One calibration point from the vendor's own H200 table: the small model takes 0.45 s for 120 s of audio and 0.41 s for 5 s — flat in duration while the FLOP count rises 24×. On a large GPU the DiT's own FLOPs are almost free and everything is launch overhead. On a 3050 that reverses, and the constant term above is what replaces it.
VRAM: 2179 MiB, and why it is flat
Weights, all fp16 unless noted (derived from confirmed parameter counts):
| component | fp16 | fp32 |
|---|---|---|
| Small DiT (433 M) | 0.87 GB | 1.73 GB |
| T5Gemma encoder (284 M) | 0.57 GB | 1.14 GB |
| SAME-S autoencoder (108.3 M) | 0.22 GB | 0.43 GB |
| total | 1.65 GB | 3.30 GB |
Measured peak was 2179 MiB = 2.13 GB, consistent with those weights plus a ~0.5 GB context and cuDNN/cuBLAS workspace allowance. The measured figure is flat across a 24× range of durations, which is the direct evidence that activation memory does not grow with output length the way the token count does: sequence length is the state variable for compute, not for VRAM.
Measured memory bandwidth
The 144 GB/s figure that appears elsewhere in the SA3 write-ups is a
datasheet product (96-bit bus × 12 Gbps), not a measurement. It was
measured on victoria (scripts/bench_membw.py), and the
datasheet is optimistic.
| quantity | GB/s |
|---|---|
| datasheet (96-bit @ 12 Gbps) | 144.00 |
| derived from the device's own memory clock: 5486 MHz × 2 × 96-bit / 8 | 131.66 |
achieved, sustained fp16 read (sum) |
127.84 |
| achieved, sustained fp32 read | 128.01 |
achieved, fp16 write (fill_) |
127.96 |
| achieved, fp16 triad (2 reads + 1 write) | 123.73 |
| achieved, weight-streaming pattern (866 MB fp16, read-only) | 128.21 |
Achieved bandwidth is 128 GB/s — 89 % of the datasheet, 97.4
% of the clock-derived ceiling. The datasheet overstates this
part by 12 %. Note the device's own memory_clock_rate is
5486 MHz, i.e. ~11 Gbps rather than the 12 Gbps the datasheet quotes,
which is most of the gap.
Two other device facts worth correcting: L2 is 1,572,864 bytes (1.5 MiB), not the 2 MB assumed elsewhere, and there are 20 SMs (matching the DiT's 20 blocks, coincidentally). The L2 transition is measurable — bandwidth peaks at 158.6 GB/s for 256 KiB working sets, leaves L2 at 1 MiB, and plateaus at 122 GB/s from 8 MiB upward.
Consequences for the weight-streaming floor, which is why this was measured:
| basis | per-step floor for 866 MB of fp16 weights | 8 steps |
|---|---|---|
| datasheet 144 GB/s | 6.01 ms | 48.1 ms |
| measured 128.21 GB/s | 6.75 ms | 54.0 ms |
Even at the measured rate, re-reading every weight once per step is 54 ms across 8 steps against a measured warm DiT time of 1,414 ms — so weight streaming is 3.8 % of the DiT stage, and the model is compute-bound on this GPU by a factor of ~26. The correction matters for the cost model but does not change that conclusion.
Sampling: 8 steps, stochastic, and duration-dependent
Default steps=8, cfg_scale=1.0, sampler
pingpong.
The schedule is warped in log-SNR, and the warp depends on
the token count. logsnr ramps linearly from
logsnr_end=2.0 down to an adaptive start of
-6.2 - log₂(T/2000), then
t = sigmoid(-logsnr), with the sigma_max=1.0
endpoint restored. Measured by calling build_schedule from
the reference library directly:
T |
logsnr_start |
the 9 schedule points |
|---|---|---|
| 387 (30 s) | −3.83 | 1.0, 0.957, 0.915, 0.838, 0.714, 0.546, 0.368, 0.219, 0 |
| 1356 (120 s) | −5.64 | 1.0, 0.991, 0.977, 0.941, 0.861, 0.704, 0.477, 0.260, 0 |
The same 8 steps spread very differently across the trajectory at different durations — a longer clip spends its early steps much closer to the noise end. The ping-pong update is stochastic, not deterministic Euler:
denoised = x - t_curr * model(x, t_curr)
x = (1 - t_next) * denoised + t_next * torch.randn_like(x)
Fresh noise enters at every step, so seed
reproducibility depends on the RNG stream and the step
count. The library also implements discrete_euler,
rk4 and flow_dpmpp; pingpong is
the distilled-model default.
Classifier-free guidance is off by default and inert
on post-trained checkpoints: cfg_scale=1.0, and the docs
state cfg_scale and negative_prompt "have no
effect on post-trained checkpoints". When CFG is active
(cfg_scale ≈ 7 on a -base checkpoint, or
--cfg 3.0 in the TRT runtime) it is batched into a single
forward at doubled batch, doubling both compute and activation memory;
the TRT engine is static batch 1 and implements it as a sequential
cond+uncond dual pass instead.
Chunked decoding is on by default, using 256-latent
windows with overlap, overridable per call via
chunked_decode=. It is a memory mechanism,
not a speed one — the vendor's TRT notes are explicit that single-shot
is 10–20 % faster above L=256 — but on a 4 GB card it is what makes a
long render possible at all.
Optional input encoding. Audio-to-audio and inpainting additionally run the SAME encoder over the init clip. Pure text-to-audio never touches it.
What did not fit:
medium
medium (1.4 B) was downloaded and attempted. It
fails on host RAM, not VRAM, and it never reached the GPU.
The mechanism is in load_diffusion_cond
(stable_audio_3/loading_utils.py):
model = create_diffusion_cond_from_config(model_config)
copy_state_dict(model, load_file(ckpt_path))   # whole 9.22 GB checkpoint
model.to(device).eval().requires_grad_(False)
load_file() materialises the entire 9.22 GB checkpoint
and copy_state_dict then builds a second state dict to copy
into, so peak host usage is a multiple of the checkpoint size before any
GPU transfer. On a 7.5 GB machine the kernel kills the process.
What the record actually shows. The download
completed cleanly: 17/17 files, 9.8 GB on disk,
DOWNLOAD_EXIT=0, 32 minutes. The kernel then logged
two OOM kills of the same Python process, at 18:20:44
and 18:32:07, with total-vm 31.5 GB and
28.8 GB respectively. Note the accounting:
anon-rss in those lines is ~0 and file-rss ~3
MB, because the memory was held as page cache over the memory-mapped
checkpoint rather than as anonymous mappings — the kernel reclaimed it
and still had to kill the process. There is no generation
output for medium: no JSON sidecar, no WAV.
The article's earlier draft reported this as "RSS climbed to 7,441
MB" and "exit code 137"; neither figure appears in any log or journal
entry, and the kernel's own accounting says total-vm
reached 28.8–31.5 GB. Treat the earlier numbers as retracted — the OOM
kills are real and timestamped, the peak-RSS figures were not
sourced.
Related correction: the weights are not "under 3
GB". The 433 M parameter count is the DiT alone.
medium's total is DiT 1.4 B + SAME-L 852 M + T5Gemma 284 M,
i.e. 5.07 GB of weights in fp16 before any workspace,
which is why the "under 3 GB fits in 6 GB" framing was never the right
question. (SAME-L's shipped model.safetensors is 3408.6 MB
fp32 → 852 M parameters; the model overview's claim of 1.7 B looks like
an fp32 byte count read as an fp16 parameter count.)
Decision: medium is not a target for
this laptop. Port it to the TPU / large-GPU side of the project
instead.
Precision: what actually runs
The checkpoint ships float32 and the library casts everything
to float16 at load. All 685 tensors in
small-music/model.safetensors are F32, and
StableAudioModel.from_pretrained(model_name, device, model_half=True)
casts the whole model down. Measured dtypes on victoria after load:
| component | parameters | dtype at inference |
|---|---|---|
| diffusion transformer | 459.1 M | torch.float16 |
| conditioner | 0.2 M | torch.float16 |
| SAME-S autoencoder | 108.2 M | torch.float16 |
| — encoder | 53.7 M | torch.float16 |
| — decoder | 54.5 M | torch.float16 |
The decoder therefore runs fp16, not fp32. An earlier version of this article stated that SAME-S should stay fp32 to avoid the differential-attention cancellation the vendor documents, costing 0.43 GB. That is a recommendation the shipped default does not follow, and the default is what all the numbers above were measured under. The vendor's warning is about the fp16 conversion of the TensorRT and MLX decoder paths; the PyTorch path casts the autoencoder to fp16 unconditionally and does not surface a warning. Whether the 120 s output actually shows the documented degradation was not tested here.
A whole-model dtype cast is available and changes both cost
and footprint. inner.to(dtype) on the loaded
model, measured with the GPU clock already ramped (bf16 is
supported on this GPU — torch.cuda.is_bf16_supported() is
true). Steady state, mean of calls 2–3, seconds:
| duration | fp16 (default) | bf16 | fp32 |
|---|---|---|---|
| 5 s | 0.335 | 0.359 | 0.750 |
| 30 s | 0.741 | 0.732 | 1.785 |
| 60 s | 1.290 | 1.317 | 3.020 |
| 120 s | 2.171 | 2.171 | 5.328 |
| peak VRAM | 2179 MiB | 2179 MiB | 2886–2988 MiB |
Stage-level:
| duration | dtype | DiT (8 steps) | decoder | peak VRAM |
|---|---|---|---|---|
| 30 s | fp16 | 0.503 | 0.211 | 2179 MiB |
| 30 s | bf16 | 0.513 | 0.206 | 2179 MiB |
| 30 s | fp32 | 1.359 | 0.400 | 2916 MiB |
| 120 s | fp16 | 1.416 | 0.734 | 2179 MiB |
| 120 s | bf16 | 1.436 | 0.719 | 2179 MiB |
| 120 s | fp32 | 3.902 | 1.400 | 2988 MiB |
bf16 and fp16 are indistinguishable in both time and memory — every fp16/bf16 pair is within 6 % and the sign of the difference flips between durations, which is what the sm_86 rate equality predicts. fp32 costs 37 % more peak VRAM and ~2.5× the time, concentrated in the DiT (3.902 vs 1.416 s at 120 s, 2.76×) more than the decoder (1.400 vs 0.734 s, 1.91×). Numeric differences between the three were not measured, so nothing here speaks to accuracy.
Why fp32 kernels appear in an fp16 trace. The
decoder's 114 parameters and 6 buffers are all float16 and
its output is float16, yet the 120 s trace contains
vectorized_layer_norm_kernel<float> and
AUnaryFunctor<float> slices. These come from regions
deliberately excluded from autocast rather than from fp32 weights:
stable_audio_3/models/blocks.py and
transformer.py decorate specific forwards with
@torch.amp.autocast("cuda", enabled=False) and cast to
.float() inside — the timestep and Fourier-feature
embeddings, and the transformer's normalisation path. So a
Half and a float variant of the same kernel
coexisting in the trace is expected, not a dtype leak.
Four backend flags are set unconditionally at import
(stable_audio_3/model.py):
torch.backends.cuda.matmul.allow_tf32 = False
torch.backends.cudnn.allow_tf32 = False
torch.backends.cuda.matmul.allow_fp16_reduced_precision_reduction = False
torch.backends.cudnn.benchmark = False
The third pins fp16 GEMMs to the fp32-accumulate rate; the fourth
disables cuDNN autotuning. generate.py exposes
--enable-tf32 and --enable-fp16-reduction so
each can be measured. The cold path also pays a one-time 17–22 ms cost
in one DiT block, which is the signature of kernel autotuning;
the flags have not been swept. Since the model runs
fp16, allow_fp16_reduced_precision_reduction = False is the
one that applies to the observed workload.
Why the decoder costs what it does
The decoder is 33.9 % of the warm 120 s request — 0.734 s against the DiT's 1.414 s across eight steps. It is not one slow kernel; it is a large number of small ones.
It runs 14 sequential chunk decodes with 39 % redundant work
decode_audio(latents, chunked=True) defaults to
chunk_size=128 and overlap=32, both in latent
units. For 120 s (1292 latent frames) the chunk starts are
0, 96, 192, … , 1152 plus a final window anchored to the
end at 1164:
| quantity | value |
|---|---|
| latent frames needed | 1292 |
| chunk size / overlap / hop | 128 / 32 / 96 latents |
| chunks actually decoded | 14 |
| latent frames decoded | 14 × 128 = 1792 |
| redundant compute factor | 1.387× |
Each chunk is a separate decoder invocation producing 524,288 samples (11.9 s of audio), and 39 % of the arithmetic is thrown away in the overlap trim.
Single-shot decode is 32 % faster, and it fits
Decoding the same 1292-frame latents directly, measured on victoria:
| mode | seconds | output | peak VRAM |
|---|---|---|---|
| chunked (library default) | 0.7344 | 5,292,032 samples | 2179 MiB |
| single-shot | 0.4985 | 5,292,032 samples | 2179 MiB |
Single-shot is 1.47× faster (0.499 s vs 0.734 s) for identical output length, and peak VRAM is unchanged at 2179 MiB — it did not exceed the card. The vendor's TensorRT notes put single-shot scratch at ~5.5 GB, but that is the TRT engine's workspace; the PyTorch path on this card did not allocate anything like it. So the chunking is not buying memory here, and it is paying 47 % more time for 39 % more work.
Where the decoder's device time goes
From the Perfetto trace of a warm 120 s call
(same_decode range: 738.7 ms wall, 734.9 ms device,
5,672 kernel slices):
| class | calls | device time | share |
|---|---|---|---|
| elementwise / copy / norm | 5,084 | 432.7 ms | 58.9 % |
| GEMM (tensor core, fp16) | 364 | 255.8 ms | 34.8 % |
| attention (flash) | 168 | 42.7 ms | 5.8 % |
| other | 56 | 3.7 ms | 0.5 % |
Device time is 99.5 % of the range's wall time, so the decoder is not idle-waiting: it is genuinely busy for 735 ms. Elementwise, copy and normalisation kernels together outnumber GEMM calls 14:1 and outweigh them, at a mean of 50–270 µs each. That is the signature of many small tensors rather than one large one: 14 decoder passes over 128-latent windows means every layer in the stack runs at a token count of a few hundred, and the per-kernel launch and tail overhead is paid 14 times over.
The DiT, by the same measure, for comparison
Over the eight steps of one thread (1,382.3 ms device across 8 × 173.7 ms; 13,472 kernel slices):
| class | calls | device time | share |
|---|---|---|---|
| GEMM (tensor core, fp16) | 1,536 | 660.7 ms | 47.8 % |
| elementwise / copy / norm | 11,608 | 604.4 ms | 43.7 % |
| attention (flash) | 320 | 116.9 ms | 8.5 % |
| other | 8 | 0.3 ms | 0.0 % |
The class shares are identical on both worker threads to three significant figures (47.8 / 43.7 / 8.5), so the mix is a property of the model rather than of which thread is counted — only the absolute call counts and device totals differ between them. The DiT is more GEMM-weighted than the decoder (47.8 % vs 34.8 %) and its elementwise share is lower (43.7 % vs 58.9 %), but both stages spend more than 40 % of device time outside the tensor cores.
Per step, one thread's DiT work is 173.7 ms of device time and 1,704 kernel slices — about 9.8 µs per slice, which is short enough that launch and tail effects are a plausible part of the cost rather than a rounding error.
Top kernels, whole warm 120 s call
Every kernel slice in the trace, both worker threads included: 20,108 slices, 2,127.9 ms total device time, against a recorded wall time of 2,213.5 ms. The two threads overlap, so this is a mix of both; the per-stage sections above each use one thread.
| calls | total ms | mean µs | max µs | % device | kernel |
|---|---|---|---|---|---|
| 488 | 529.65 | 1085.3 | 1594.0 | 24.9 % | sm80_xmma_gemm_f16f16_f16f32 tn tilesize160x128x32 |
| 420 | 203.22 | 483.9 | 962.9 | 9.6 % | sm80_xmma_gemm_f16f16_f16f32 tn tilesize192x128x32 |
| 1769 | 159.94 | 90.4 | 509.6 | 7.5 % | at::native::elementwise_kernel<128,4> |
| 488 | 159.59 | 327.0 | 563.3 | 7.5 % | pytorch_flash::flash_fwd_kernel<64,128,128,4> |
| 480 | 99.56 | 207.4 | 209.5 | 4.7 % | ampere_fp16_s1688gemm_fp16_128x128 |
| 1660 | 86.59 | 52.2 | 516.7 | 4.1 % | direct_copy_kernel_cuda |
| 994 | 82.76 | 83.3 | 169.7 | 3.9 % | float16_copy_kernel |
| 1084 | 67.31 | 62.1 | 113.3 | 3.2 % | at::native::elementwise_kernel<128,2> |
| 1250 | 67.23 | 53.8 | 116.3 | 3.2 % | AUnaryFunctor<float> |
| 1098 | 65.03 | 59.2 | 85.3 | 3.1 % | CUDAFunctor_add |
| 640 | 64.03 | 100.1 | 126.3 | 3.0 % | vectorized_layer_norm_kernel<Half> |
| 480 | 53.00 | 110.4 | 113.1 | 2.5 % | vectorized_layer_norm_kernel<float> |
| 84 | 46.54 | 554.0 | 555.3 | 2.2 % | cutlass_80_tensorop_f16_s16816gemm_relu |
| 336 | 28.01 | 83.4 | 112.8 | 1.3 % | tanh_kernel_cuda |
Three observations the numbers support without interpretation: the
two 160x128x32 and 192x128x32 GEMM tile shapes
alone are 34.5 % of all device time;
flash_fwd_kernel runs with a head dim of 64 and is
7.5 %; and vectorized_layer_norm_kernel appears in
both Half and float variants, 117 ms combined
— so some normalisations are not in the model dtype.
Measurement conditions
Reproducing these numbers depends on two things that are easy to get wrong on this host, and both were hit during this pass.
The GPU idles at 210 MHz and ramps under load.
nvidia-smireportsclocks.sm210 MHz idle against a 1490 MHz maximum. A short measurement taken before the ramp completes reads roughly 2× slow across every stage uniformly — an early dtype sweep in this pass produced a 30 s DiT of 1.47 s that fell to 0.69 s once the card was warm, with decode scaling identically. Numbers here were taken with the clock already ramped;scripts/gpuwatch.pysamples clocks alongside a run so a timing can be labelled with the clock it was measured at. Compare only measurements taken at the same clock state.Victora is a shared machine and concurrent GPU work invalidates a measurement. A sustained-bandwidth soak that read a flat 127.83–127.85 GB/s for 45 consecutive windows collapsed to 59–73 GB/s in three later stretches with memory and SM clocks unchanged and power rising to 37–46 W. The journal shows three concurrent short-lived sessions running GPU work in those same minutes, so it was contention, not throttling. Under contention, bandwidth fell by ~45 % and every timing in this article would be wrong by a similar factor. Check
nvidia-smi --query-compute-appsbefore trusting a run.The GPU does not throttle under sustained load. A 90 s read soak held the memory clock pinned at its 5486 MHz maximum and the SM at 1702–1725 MHz, with temperature 53→60 °C at ~31 W. The flat 128 GB/s figure is a sustained number, not a burst.
torch.profilerinflates wall time without changing the ranking. The traced 120 s call shows 174 ms per DiT step against an untraced 177 ms, so inflation is small here; the decode figure is likewise nearly unaffected (713.8 ms traced vs 734 ms steady state). Kernel shares and per-kernel means from the trace are sound, and the per-step shape — including the step-1 anomaly — is only visible in the trace.The binding constraint on this host is disk and host RAM, not compute. The card used 2179 of 6144 MiB; the machine ran out of host memory loading
medium, and the 9.8 GB download took free space from 24 GB to 15 GB. The GPU is the least contended resource in the system.flash_attndoes not work here as configured. A cachedflash_attn-2.8.3wheel installs, but its.sowas built against torch 2.7.1 and fails under 2.13 with an undefined symbol (c10_cuda_check_implementation).small-musicdoes not need it;mediumdoes, and falls back to the library's own SDPA cascade rather than raising. The trace nevertheless showspytorch_flash::flash_fwd_kernelrunning at 7.5 % of device time, so the SDPA cascade is selecting a flash kernel from somewhere.small-musicruns fully offline. A complete checkpoint already existed locally (2.27 GBmodel.safetensors+ 1.18 GBt5gemma-b-b-ul2/model.safetensors), so no download was needed for the runs above.torchaudio.save()needstorchcodec, which is not a declared dependency;generate.pywrites throughsoundfileinstead.Per-request cost is
2.04 + 0.0172 × durationcold and0.29 + 0.0163 × durationwarm. The two differ almost entirely in the constant. A first request in a fresh process costs 1.4–2.1 s more than every request after it.
Corrections to the primary sources
Three discrepancies found reading the release against its own artifacts. Each is independently checkable and each materially changes a footprint estimate.
- Latent count per second is misstated by 2× in the model overview — it claims 216 latents for a 10 s clip; the correct value is 108, i.e. 10.7666 latents/s at 4096 samples per channel. Confirmed three ways (TRT L-range endpoints, the "L=8192 is 761 s" note, and the SAME-S decoder ceiling of L=1292 = exactly 120 s).
- Autoencoder parameter counts do not match the shipped
weights. The doc says SAME-S 266 M and SAME-L 1.7 B; the
artifacts give 108 M and 852 M. SAME-S
is confirmed twice to four digits — the MLX fp32 encoder and decoder
files sum to 433.0 MB, exactly the size of
stabilityai/SAME-S'smodel.safetensors. The 1.7 B figure appears to be an fp32 byte count read as fp16 parameters. Possible that the doc figures are training-time totals including the SAME paper's diffusion-alignment model and discriminators; unconfirmed. - The small model's maximum duration is stated
inconsistently across the README (380 s for
medium) and the model-overview table (medium~4.75 min,large~6.3 min). The duration conditioner clips at 384 s, which supports the README. Not resolved.