Stable Audio 3 medium: one TPU chip against an L4, module by module
Stable Audio 3 medium is a 1.4 B DiT plus a 426 M SAME-L
decoder and a 282 M T5Gemma text encoder — 2.16 B parameters that the
reference runtime ships for CUDA only. This report profiles the JAX port of that
model on one Colab TPU v6e-1, and then runs the
same port and the official PyTorch runtime on the
same L4 so the TPU number has a frame of reference on both
sides: how fast is our port against the thing it is porting, and how
much does the accelerator contribute.
Every latency below is a warm median with the device synchronised
around the region (jax.block_until_ready() /
torch.cuda.synchronize()); XLA compile, the first
post-compile call and the 10.4 GB of weight staging are reported
separately from the steady-state number. One prompt, one seed, 8 steps,
batch 1, 120 s of audio (T = 1358 latents) unless a row says
otherwise.
1. What was run
| TPU v6e-1 | L4 (JAX) | L4 (torch) | |
|---|---|---|---|
| runtime | jax 0.7.2, XLA:TPU | jax 0.11.2, XLA:GPU | torch 2.7.1+cu126 |
| dtype | bf16 | bf16 | fp16 |
| attention | our SDPA (einsum) | our SDPA | Flash Attention 2.6.3 |
| decoder | SAME-L, unchunked | SAME-L, unchunked | SAME-L, chunked |
| host | Colab TPU VM | Modal L4, 23 GiB | Modal L4, 23 GiB |
Three things about that table change how the numbers must be read, and none of them are in our favour:
- Chunked vs unchunked decode. The reference's
shipped
mediumconfig decodes in chunks; our port decodes the whole 1358-latent sequence in one call. The decode comparison is therefore a comparison of two different computations, and is labelled as such. - fp16 + Flash Attention vs bf16. Both JAX runs are bf16 with an einsum SDPA, which is what the port ships; the torch run is the reference's own default. The dtype lever moves latency on both sides, so cross-framework ratios are of ports-as-shipped, not of dtypes-as-matched.
- One chip. The v6e-1 run is a single chip with no sharding — the port has no mesh. Nothing here is a scale-up result.
medium was also, until this run, not wired end
to end in the port: pipeline.render hardcodes the
SAME-S decoder, so generate(cfg=MEDIUM) does not raise — it
silently returns correctly-shaped, wrong audio. These runs compose the
medium path from the module functions and call
same_l.decode directly. That gap is a real defect in the
port and is recorded as one.
2. The budget at 120 seconds
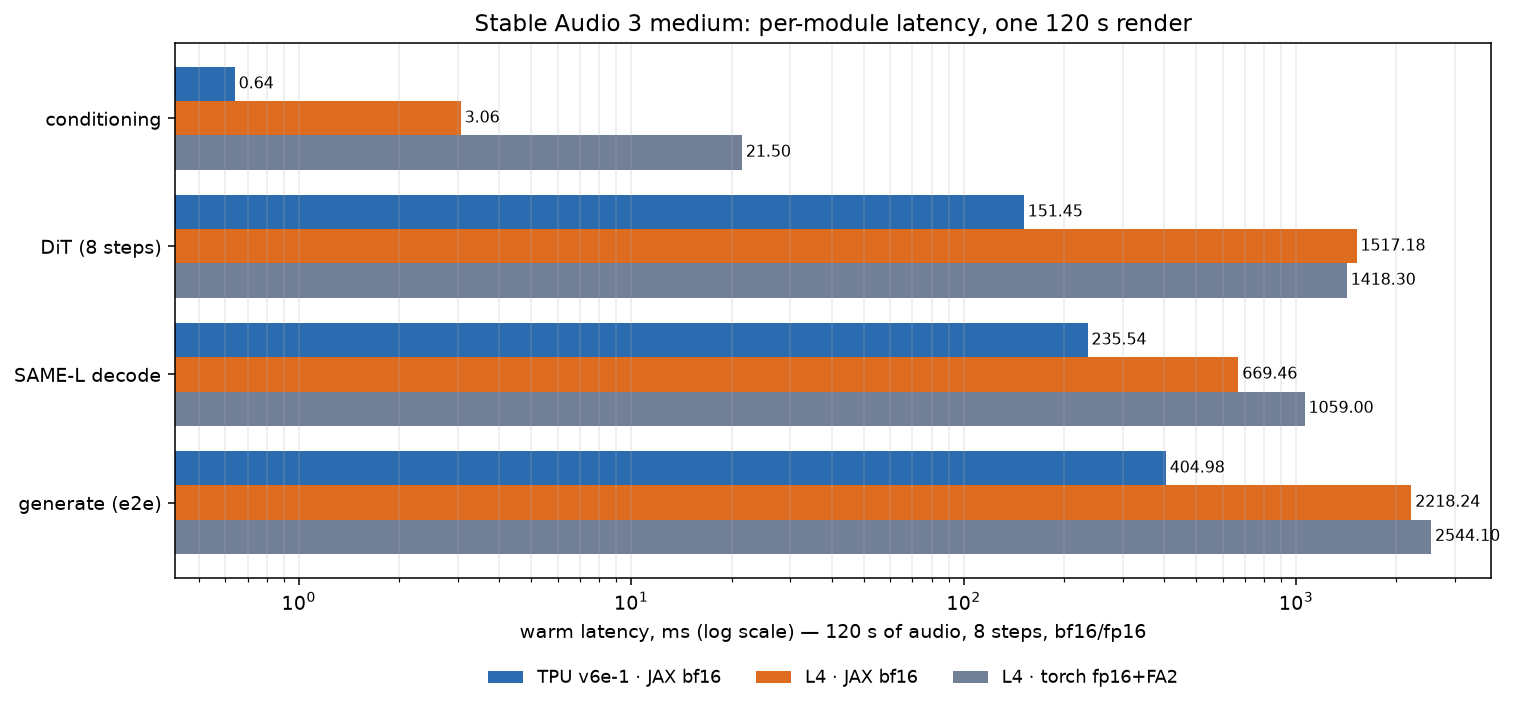
| module | TPU v6e-1 (bf16) | L4 (bf16) | L4 torch (fp16+FA2) |
|---|---|---|---|
| text encoder + conditioning | 0.64 ms | 3.07 ms | 21.50 ms |
prepare_static (eager) |
9.39 ms | 21.30 ms | — |
| DiT, 8 steps (24 blocks) | 151.45 ms | 1517.18 ms | 1418.30 ms |
| SAME-L decode | 235.54 ms | 669.46 ms | 1059.00 ms (chunked) |
generate end to end |
404.98 ms | 2218.24 ms | 2544.10 ms |
| real-time factor | 0.00337 (297×) | 0.01849 (54×) | 0.02090 (48×) |
Two facts dominate. First, the TPU's DiT is 10× the L4's for identical JAX source (151 vs 1517 ms), which is a larger gap than the chips' nominal throughput difference and points at bandwidth and fusion rather than arithmetic alone. Second, the SAME-L decoder costs more than the whole DiT on the TPU (236 vs 151 ms — 1.56×), where on the L4 it is 44 % of the DiT in JAX and 75 % in torch. The decoder is where the TPU's advantage is smallest (4.5× against torch, versus 9.4× for the DiT): it is a conv-and-scan structure with small widths, which suits neither the L4's tensor cores nor the TPU's wide matmuls.
The text encoder is invisible on TPU (0.64 ms) and free on both GPUs relative to the DiT, but the spread there is the largest in the table — 33× between the TPU and torch — because it is a small, latency-bound, host-issued stage.
3. How good is 405 ms? Measured against the modelled floor
The roofline report (klein-sa3-tpu-roofline, source
flicker/docs/roofline.md) modelled SA3 medium
module by module but could not measure it: its §1 states plainly that
"medium has never been loaded on any hardware",
and every SA3 wall time there is tagged derived. This run closes that
loop. The model's own functions — sa3_dit,
sa3_codec, t5_trunk — are imported and divided
by the measured times (scripts/roofline_medium.py), so the
two sides cannot drift apart.
| module, 120 s clip | modelled GFLOP | measured | achieved | % of 918 peak | % of 380 measured | floor @380 | measured / floor |
|---|---|---|---|---|---|---|---|
| DiT, 8 steps | 32 947 | 151.45 ms | 217.5 TFLOP/s | 23.7 % | 57.2 % | 86.68 ms | 1.75× |
| SAME-L codec | 18 531 | 235.54 ms | 78.7 TFLOP/s | 8.6 % | 20.7 % | 48.75 ms | 4.83× |
| T5Gemma encoder | 46 | 0.53 ms | 86.9 TFLOP/s | 9.5 % | 22.9 % | 0.12 ms | 4.38× |
whole clip (generate) |
51 524 | 404.98 ms | 127.2 TFLOP/s | 13.9 % | 33.5 % | 135.55 ms | 2.99× |
Two rates, because they answer different questions. 918 TFLOP/s is v6e-1's bf16 datasheet peak, which is what a "% of peak" claim is usually measured against. 380.1 TFLOP/s is what a warmed 4096³ bf16 GEMM actually reaches on one v6e-1 chip — 41.4 % of datasheet. Scoring against the second removes the hardware's shortfall and leaves the model's, which is the only way "is this module efficient?" is a fair question.
The DiT is close to its roofline; the codec is not. The 24-block DiT runs at 217 TFLOP/s — 57 % of the rate the chip reaches on a plain GEMM, 1.75× its achievable floor. That is a well-optimised module, and closer than the roofline's own klein DiT measurement on an L4 (2.77× its floor). The SAME-L decoder runs at 79 TFLOP/s — 21 % of the same rate, 4.83× its floor. Same chip, same run, same dtype: the codec sits 2.8× further from its floor than the DiT, and is 1.56× the DiT's wall time while doing 44 % less work.
That is what the model predicted without knowing the hardware.
Roofline §6 classified four SA3 rows as memory-bound on v6e —
cross to_q/to_kv (AI 367), cross attention
(444), cross to_out (499) and mlp (527), all
under the 560 ridge — and the codec's qk DyT + rope at an
arithmetic intensity of 0.8, moving 10.2 GB of traffic
for 8.5 GFLOP. Roofline §7 then gave the calibration rule: multiply a
floor by 2.5 for a GEMM-dominated module and
3–6 for a convolutional or small-shape one. Measured:
DiT 1.75×, codec 4.83×. The model's shape survived contact with a chip
it had never run on.
One caveat on the direction of the comparison: these GFLOPs are the
model's counts, not hardware counters, so "achieved TFLOP/s" inherits
its conventions (MAC = 2 FLOPs, 4·d + 5 per attention
score, both differential SDPAs counted). The ratios between
modules are robust; the absolute percentages are only as good as
the count.
What this changes about the plan. The gap is not
uniform, so a single optimisation cannot close it: 1.75× in the
DiT, 4.83× in the codec. The codec's deficit is a memory
problem — its traffic is 35.9 GB of the clip's 112.8 GB — and int8
attacks it twice, halving both the weights and the traffic. The DiT's
own gap is concentrated in one modelled row:
cross to_q/to_kv recomputes K/V from the 257 context tokens
in every block of every step — 906 MB of weights, 24
times per step, 8 steps per clip, for a tensor that never changes.
Roofline §8 calls hoisting it "the one change in either model that is
free", and the port already flags it (sa3jax/dit.py,
deferred to M8).
4. Idle device time
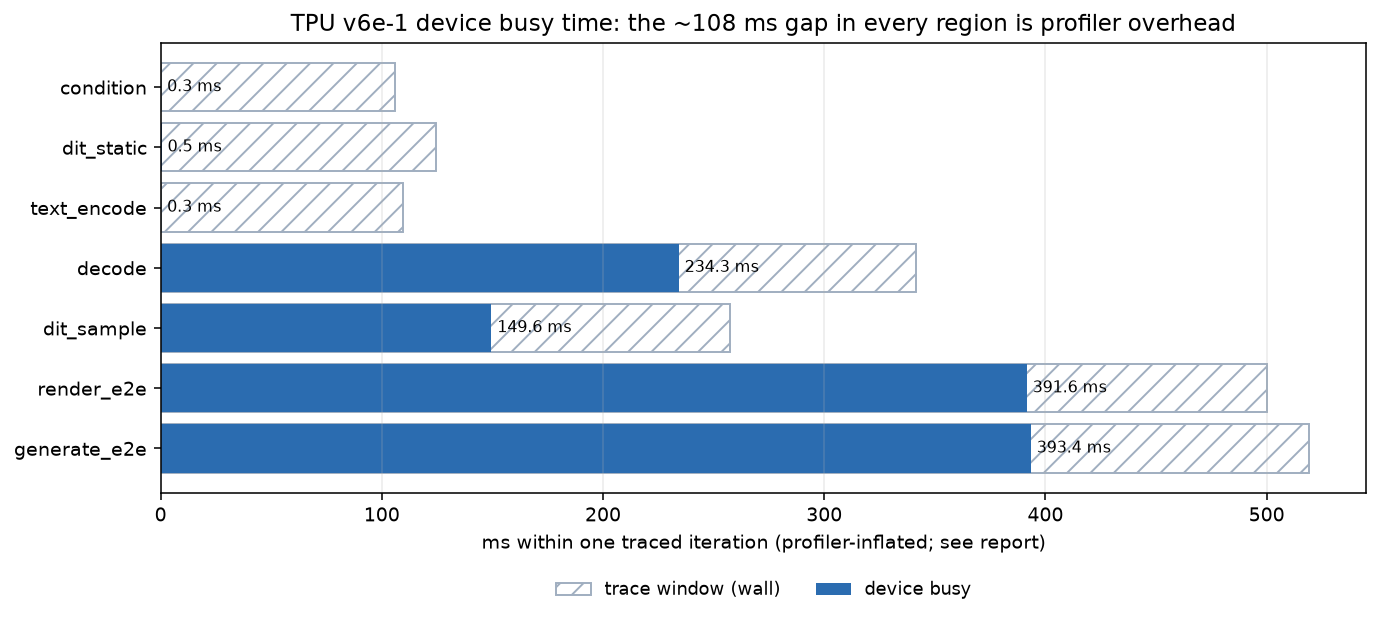
The user-visible question "how much of the request is the accelerator
idle?" is answered from the XProf capture, not from arithmetic: the
.xplane.pb records /device:TPU:0 and
/host:CPU as separate processes, so the union of the device
process's spans is the TPU's busy time.
| region | trace window | device busy | device util |
|---|---|---|---|
| text encoder | 109.7 ms | 0.31 ms | 0.3 % |
| conditioning | 105.8 ms | 0.32 ms | 0.3 % |
prepare_static |
124.5 ms | 0.51 ms | 0.4 % |
| DiT, 8 steps | 257.4 ms | 149.6 ms | 58.1 % |
| SAME-L decode | 341.4 ms | 234.3 ms | 68.6 % |
| render (sampler+decoder) | 500.0 ms | 391.6 ms | 78.3 % |
| generate (e2e) | 519.1 ms | 393.4 ms | 75.8 % |
The busy column is a cross-check, not a new
measurement. Device busy lands within 1.5 ms of the harness's
warm median in every region that does device work — DiT 149.6 vs 151.4,
decode 234.3 vs 235.5, render 391.6 vs 393.9, generate 393.4 vs 405.0 —
from a different instrument. Where the two disagree is the point: the
trace's device time is ~1 % below the harness, and for
generate it is 11.6 ms below, which is precisely the
host-side work.
The idle reading needs one correction before it means
anything. Every region, including ones with 0.3 ms of device
work, shows ~108 ms of "idle" — that is the profiler's own
start_trace (13 ms) and stop_trace (93 ms), a
constant floor that has nothing to do with the model. Subtract it and
the picture is unambiguous: during render_e2e the TPU is
busy 391.6 ms of a ~392 ms window, i.e. **~100 % device-bound**; the
sampler and decoder jits leave essentially no bubble. The end-to-end
generate gives up **~12–18 ms (3–4 %)** to host-side work,
and it is concentrated in one place — the eager
dit.prepare_static (9.4 ms, which contains a device→host
sync to validate local_add_cond) plus postprocess. At 120 s
that is the entire optimisable idle budget: there is no hidden stall to
find, and the next win is making prepare_static
device-resident or hoisting it out of the request, worth at most ~4
%.
5. The traces
Every figure below comes in three depths: the stage (one whole iteration), a zoom (a 500 µs window), and a tight crop (50 µs). The depths are set in microseconds rather than as a fraction of the stage because these tracks are far denser than they look — the DiT carries 56 369 device events in 149 ms, a median op of 0.3 µs, about 600 ops per millisecond. A 20 ms window still renders every label as a sub-pixel sliver; 50 µs is what leaves each slice tens of pixels wide, which is the width Perfetto needs before it draws text at all.
The whole 120 s request, everything resident.
jit_render_jit is the shipping single jit boundary (sampler
+ decoder); the host process below it is the
block_until_ready wait.
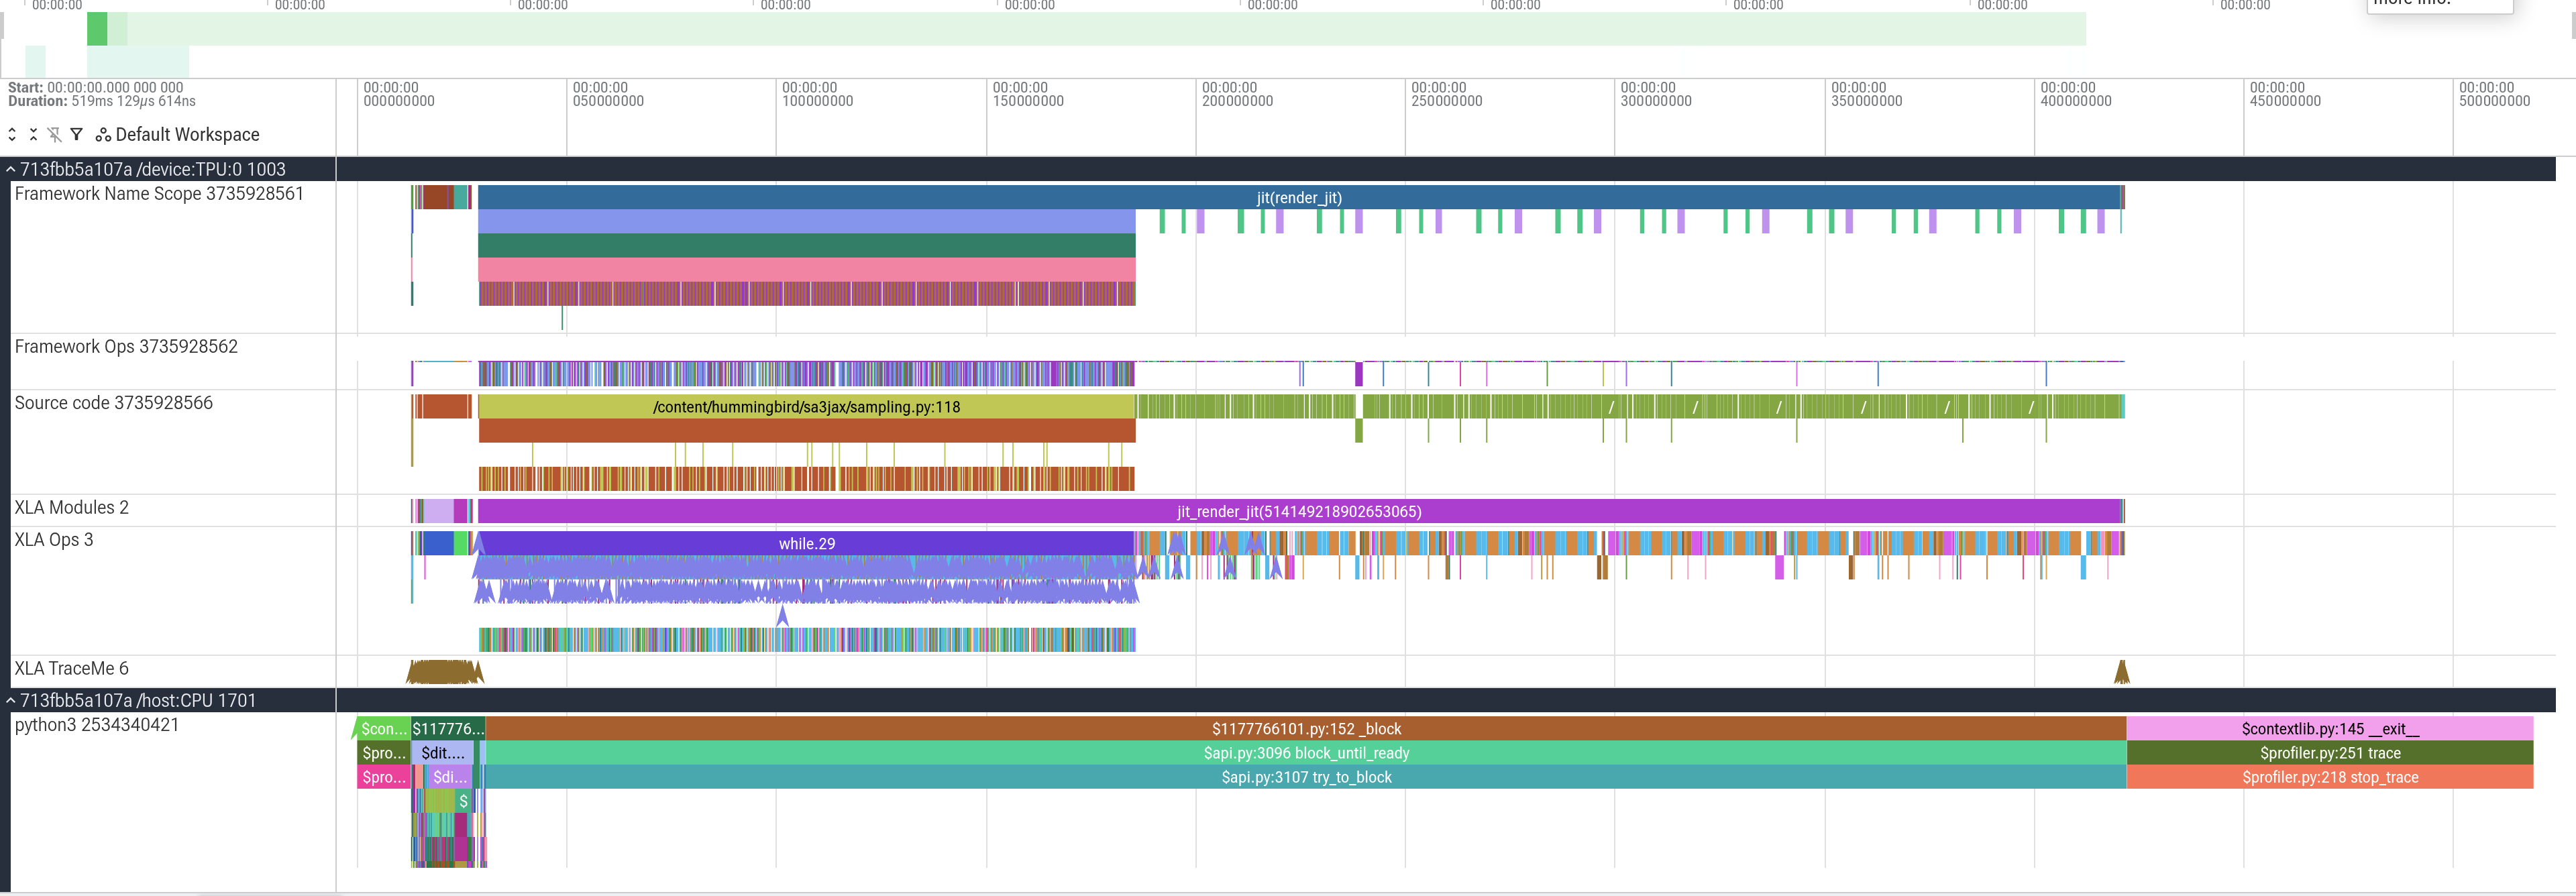
The 8-step DiT scan. The while.29 loop is the Euler
pingpong sampler and each narrow slice inside it is one of the 24
blocks.
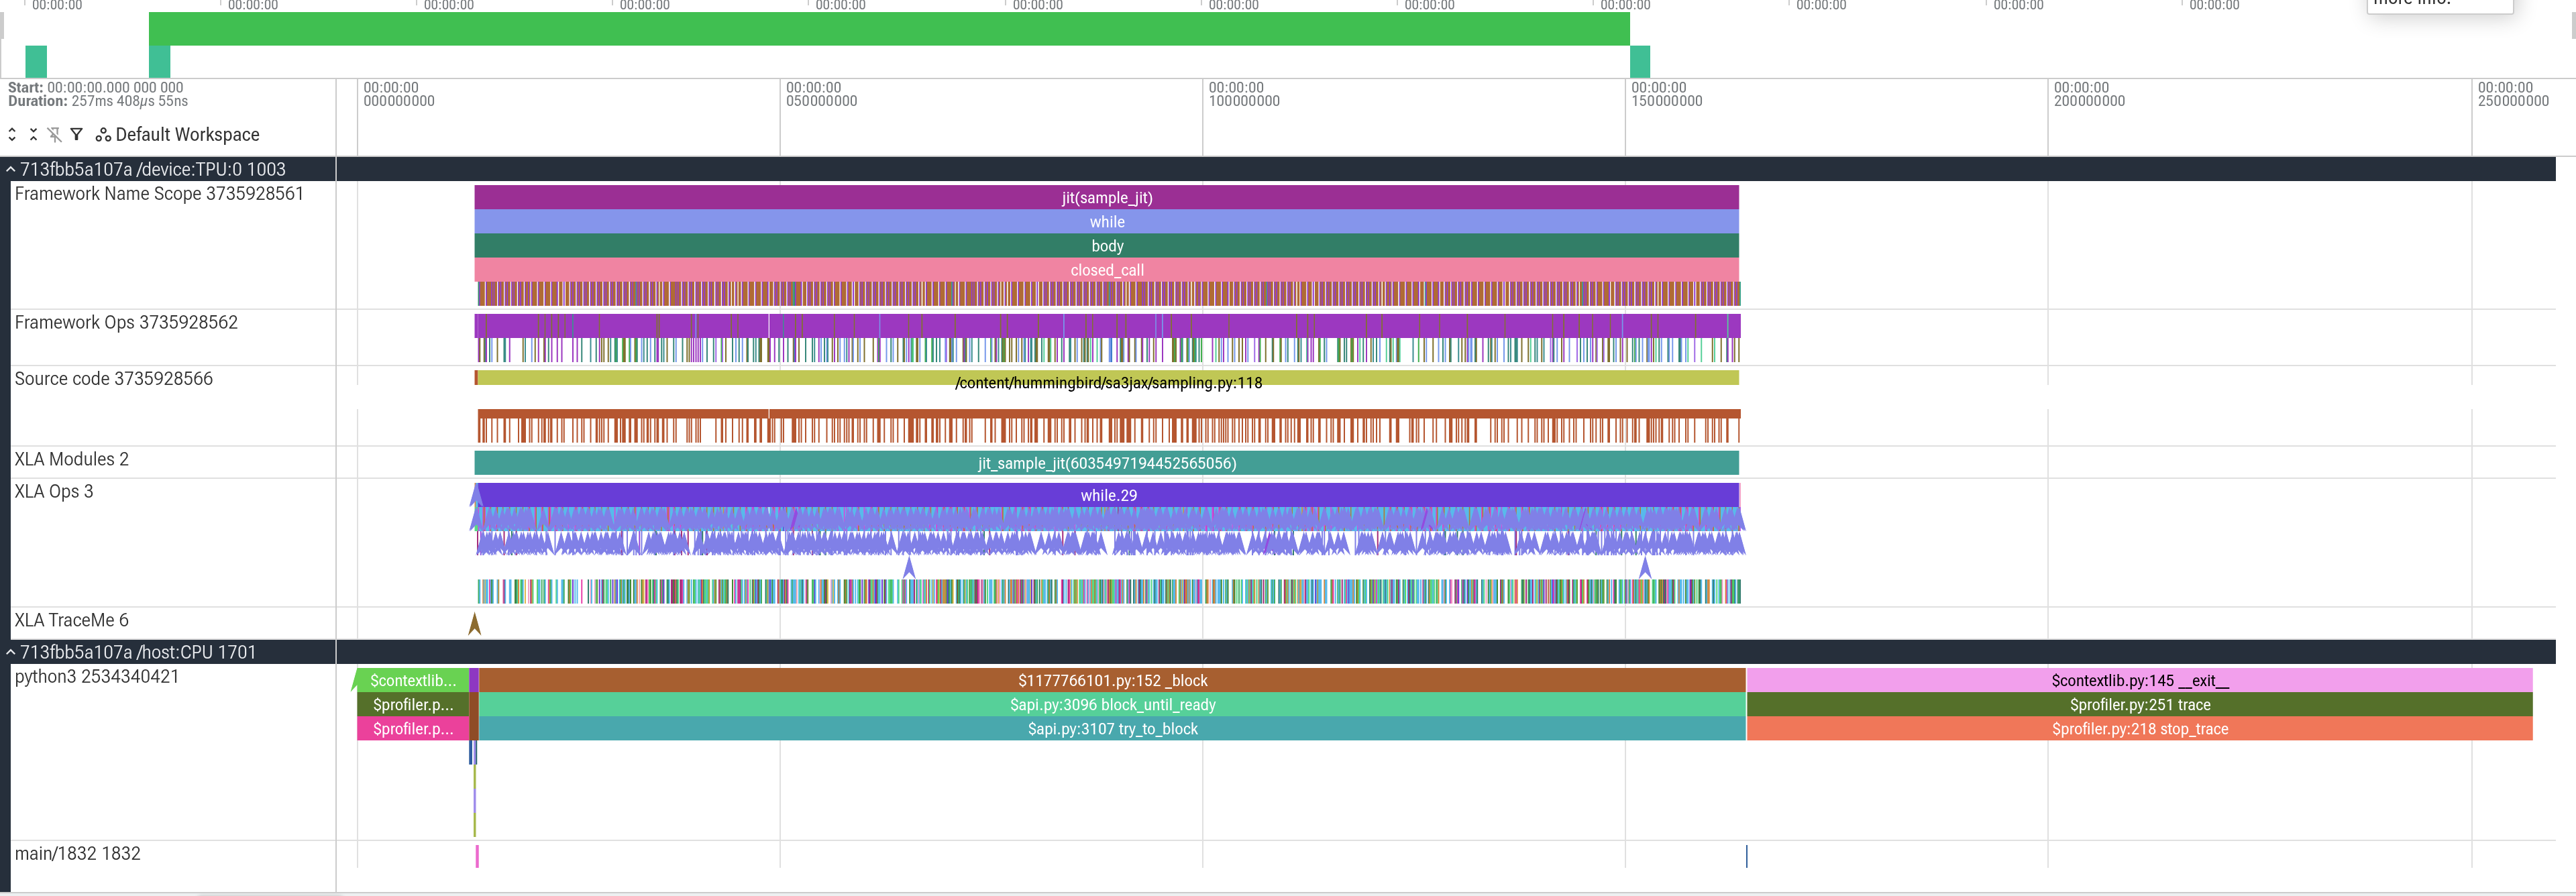
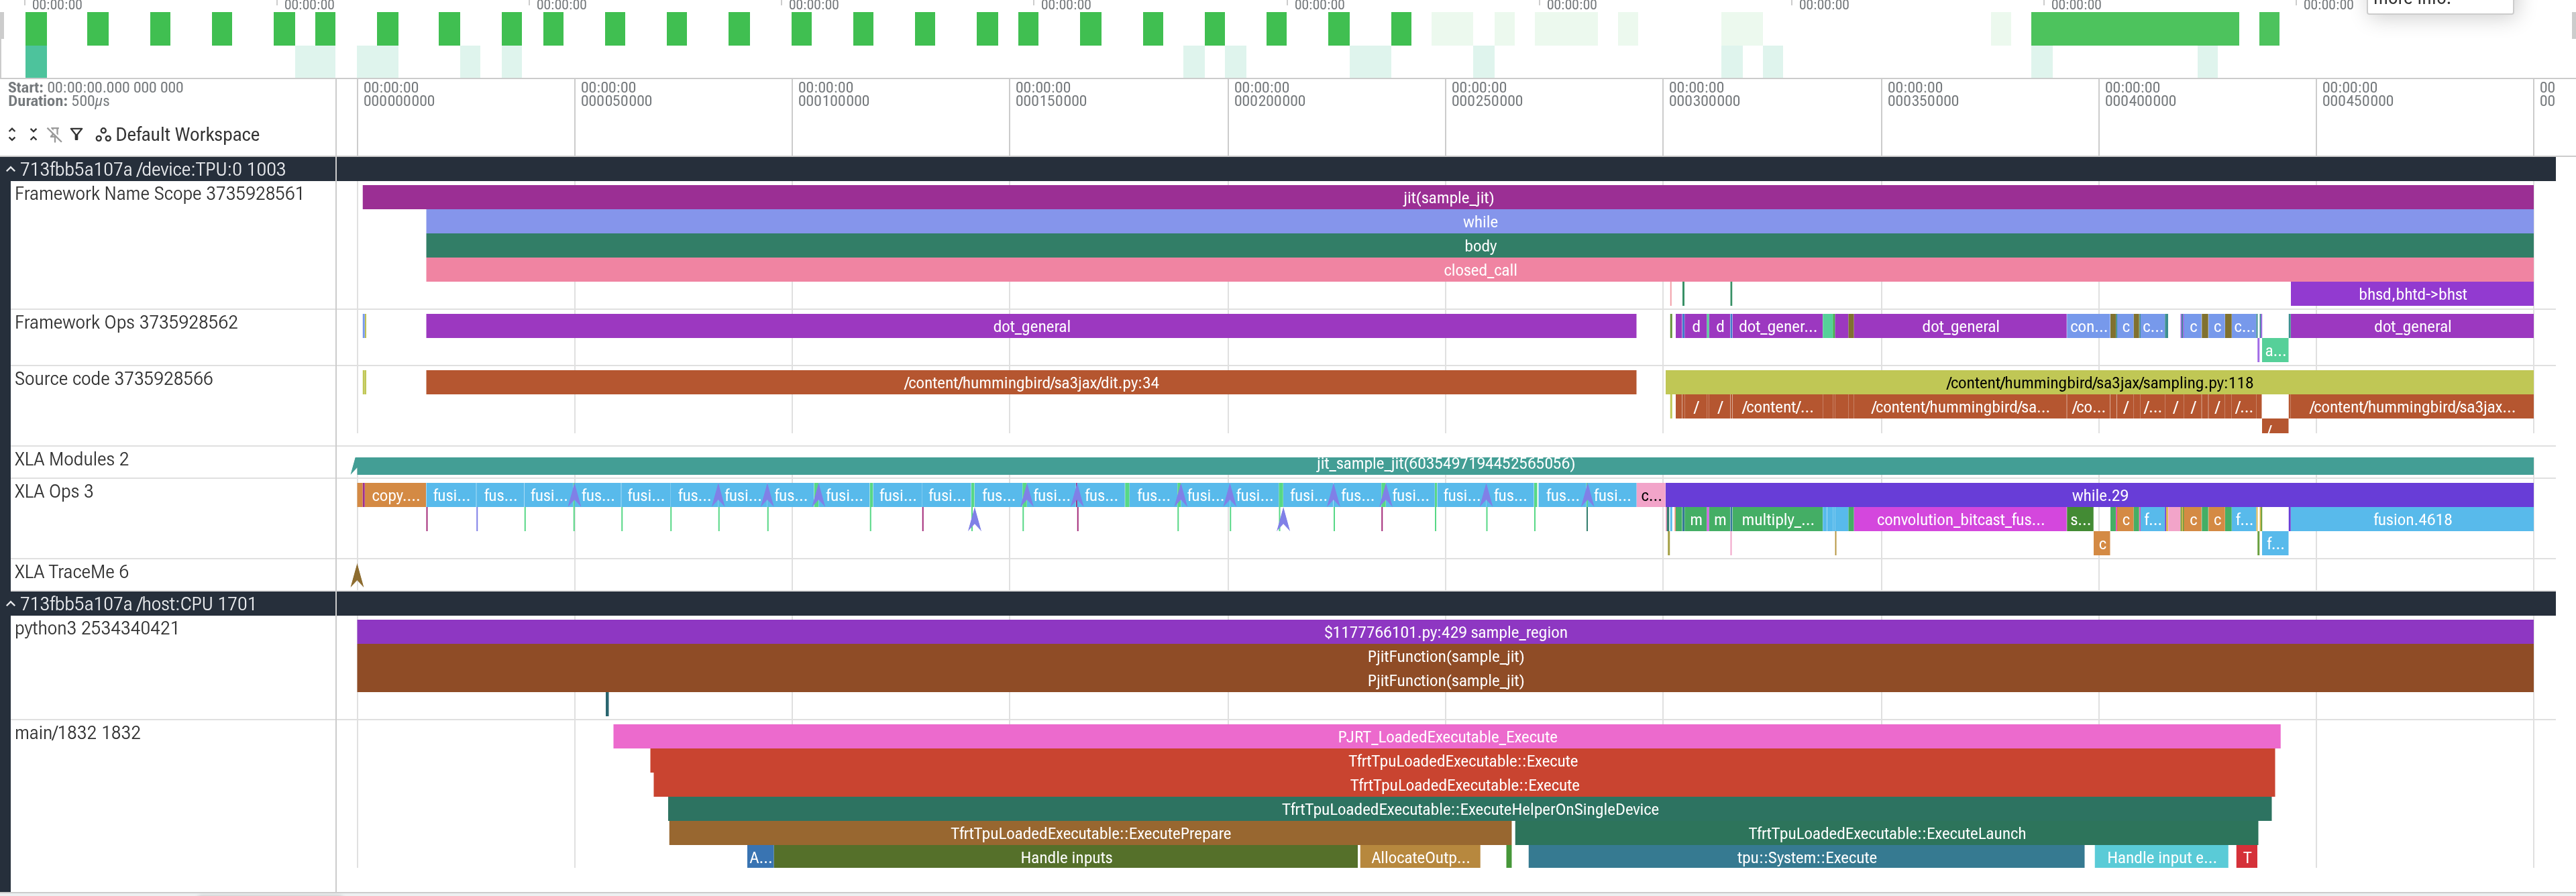
At 500 µs the block structure resolves. This is the figure the XProf
capture buys: Framework Name Scope shows
jit(sample_jit) → while →
closed_call, and the
Source code track attributes the work to
/content/hummingbird/sa3jax/sampling.py:118 — the scan
body. /device:TPU:0 and /host:CPU are separate
processes, which is what makes §4 a measurement.
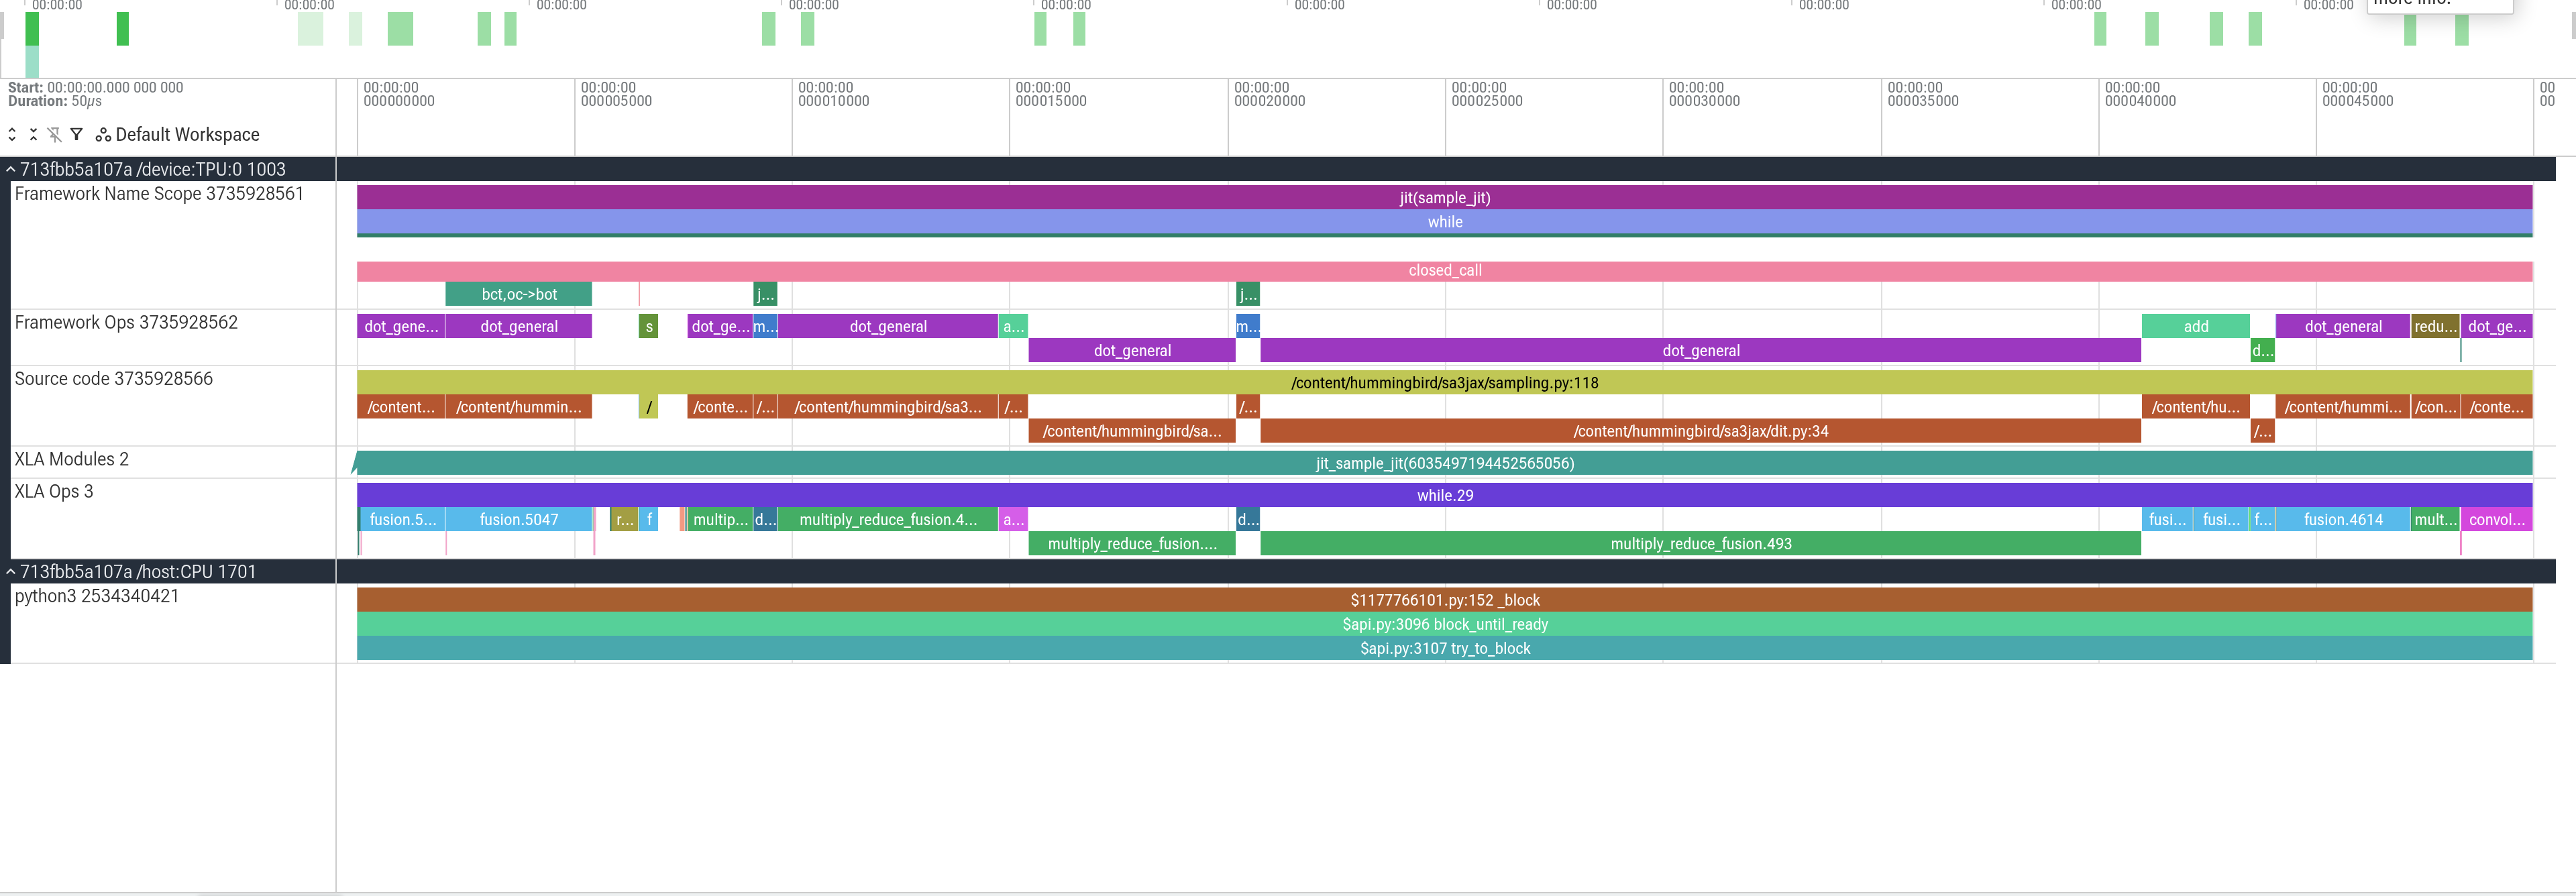
At 50 µs the individual kernels are named: dot_general
and bot_oc->bot on the Framework Ops track,
multiply_reduce_fusion.493 / fusion.5047 /
fusion.4614 on XLA Ops, and the two Python
frames that issued them — dit.py:34, the
x @ weightᵀ inside _linear, and
sampling.py:118, the lax.scan call. This is
the attribution an HLO name alone cannot give.
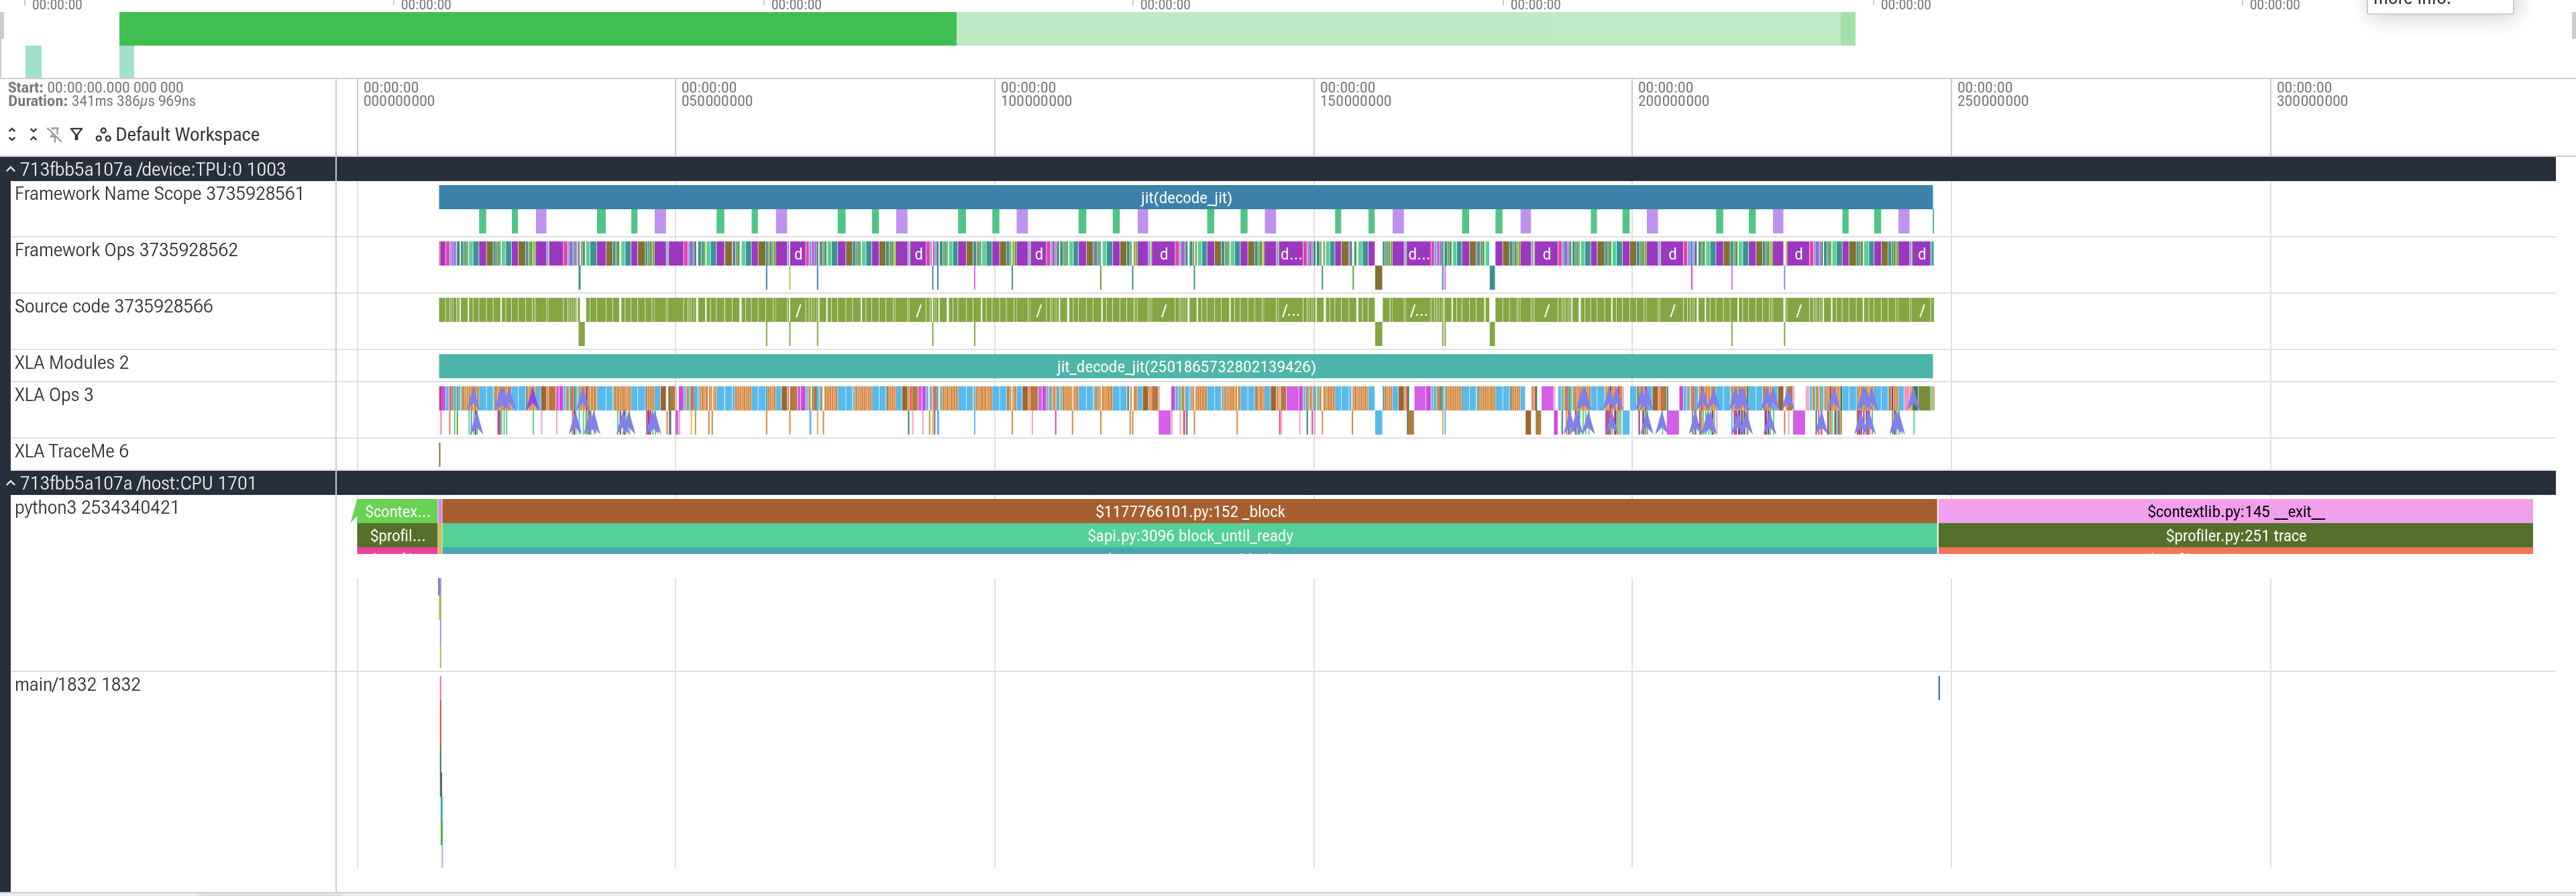
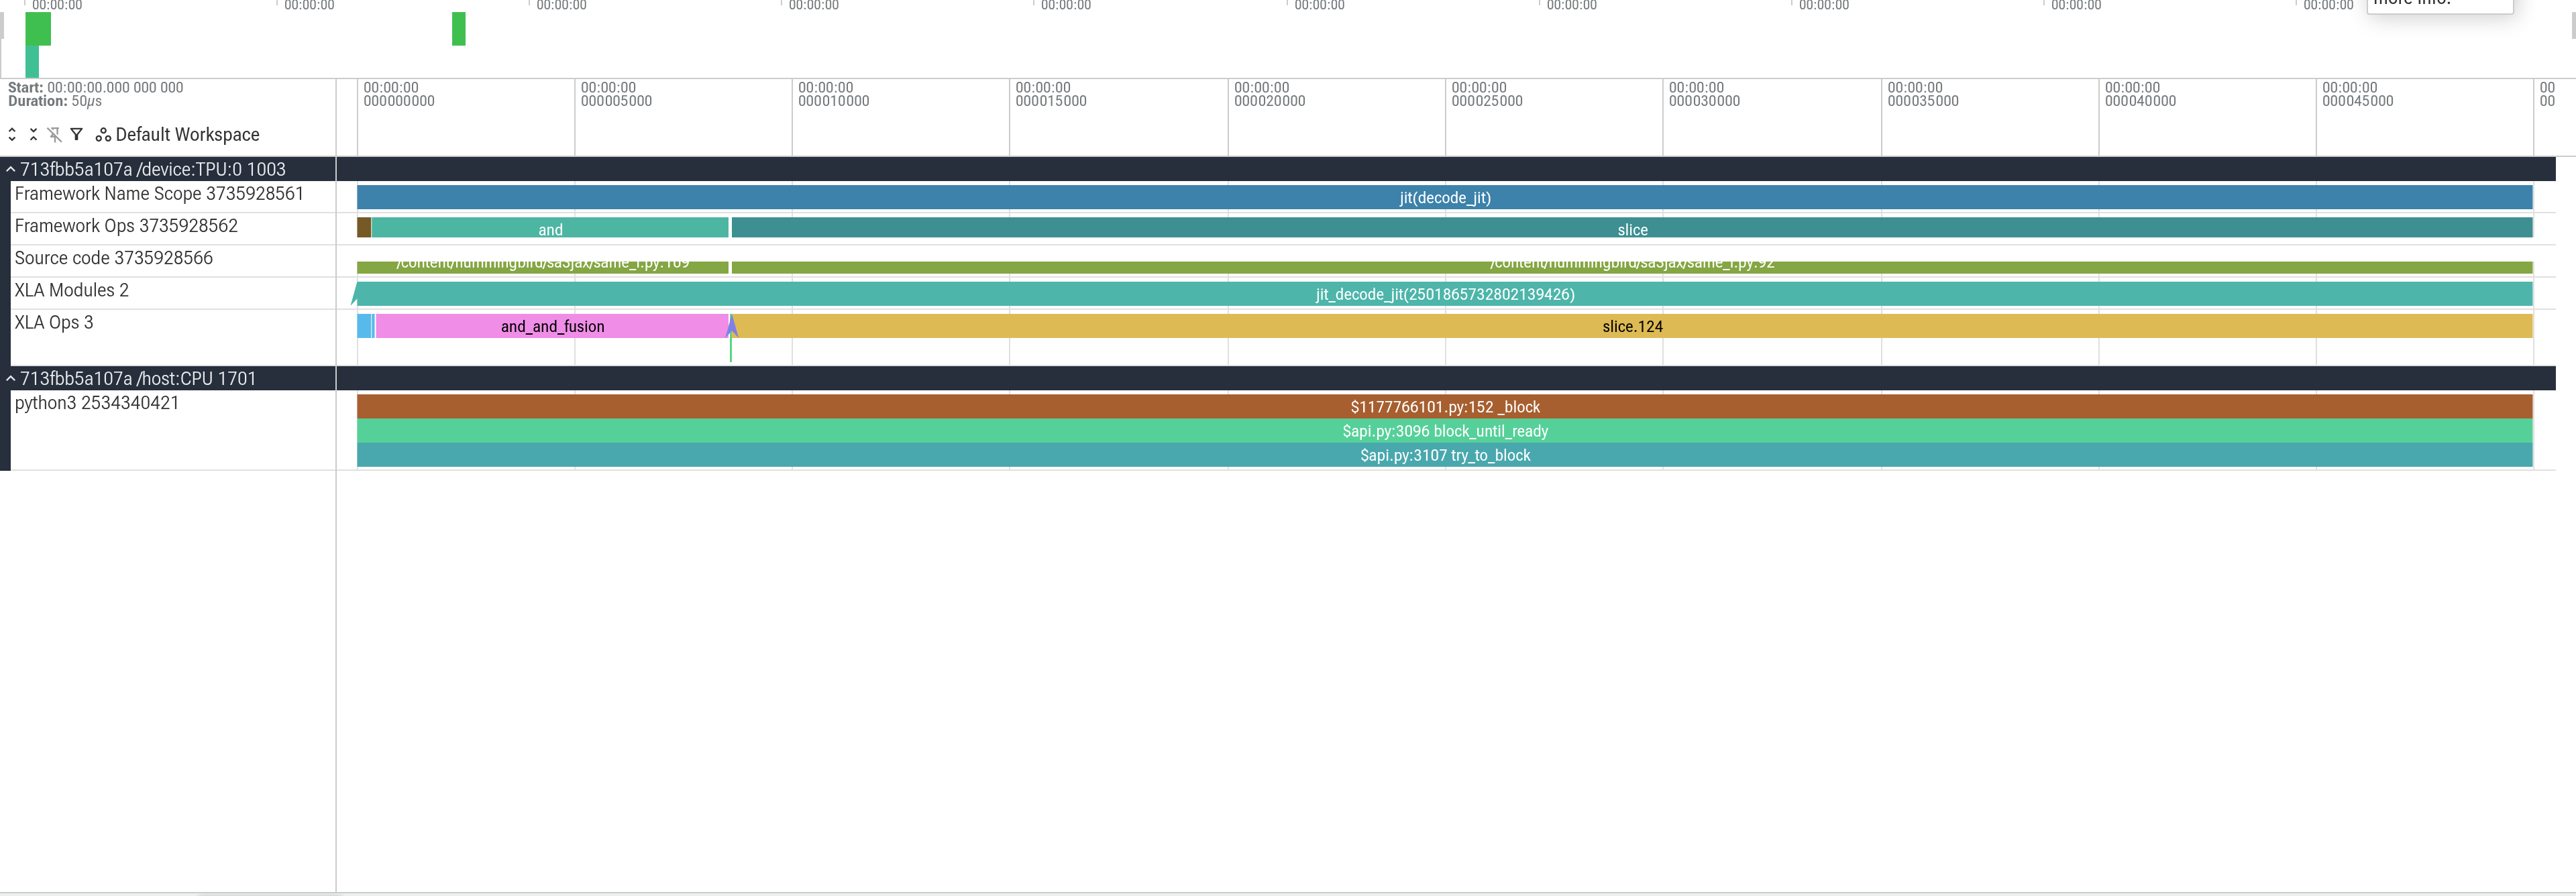
The SAME-L decoder, which is 236 ms — larger than the whole DiT scan.
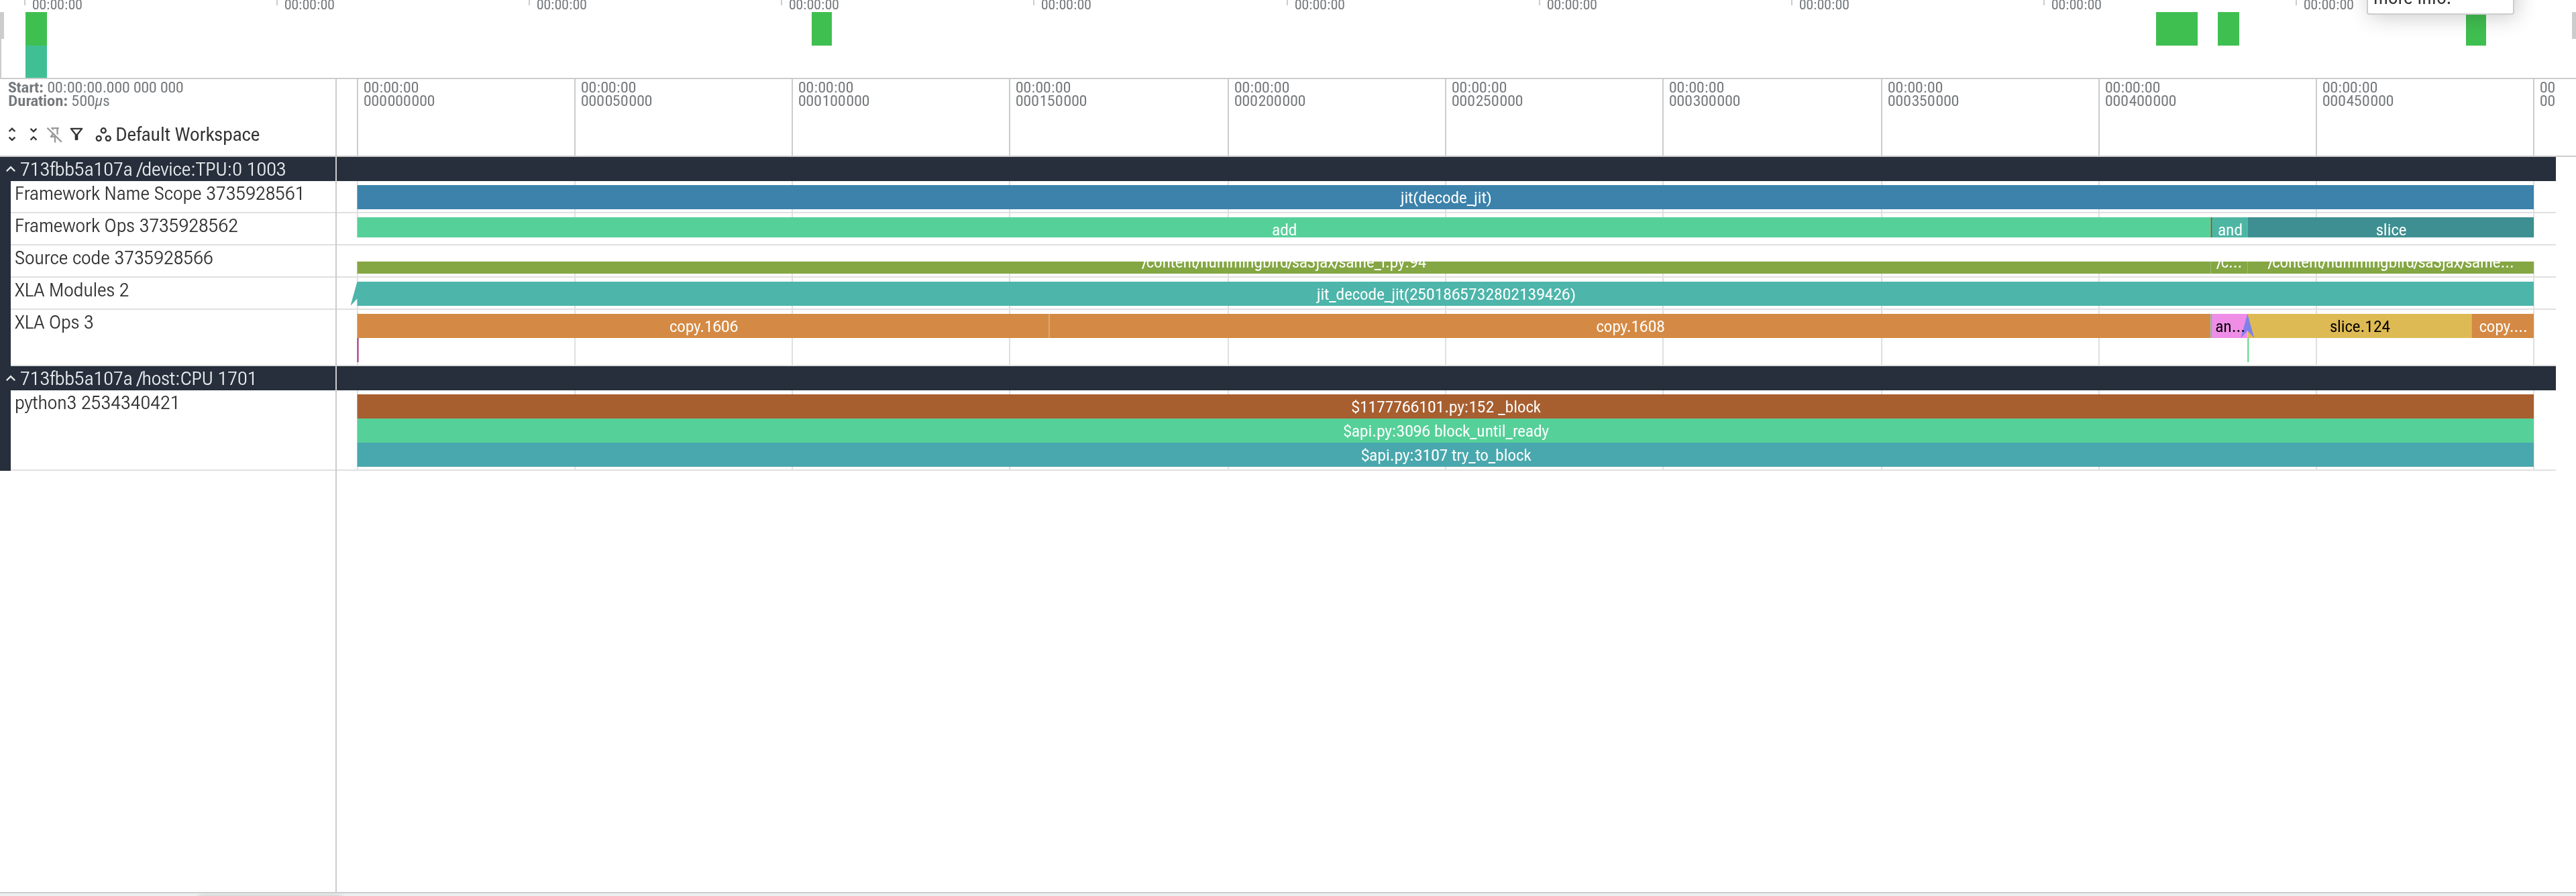
The decoder at 50 µs: and_and_fusion,
slice.124, and two Python frames —
same_l.py:109, the sliding-window mask
|k − q| ≤ 2·stride, and same_l.py:92, the
rotary embedding that feeds attention.
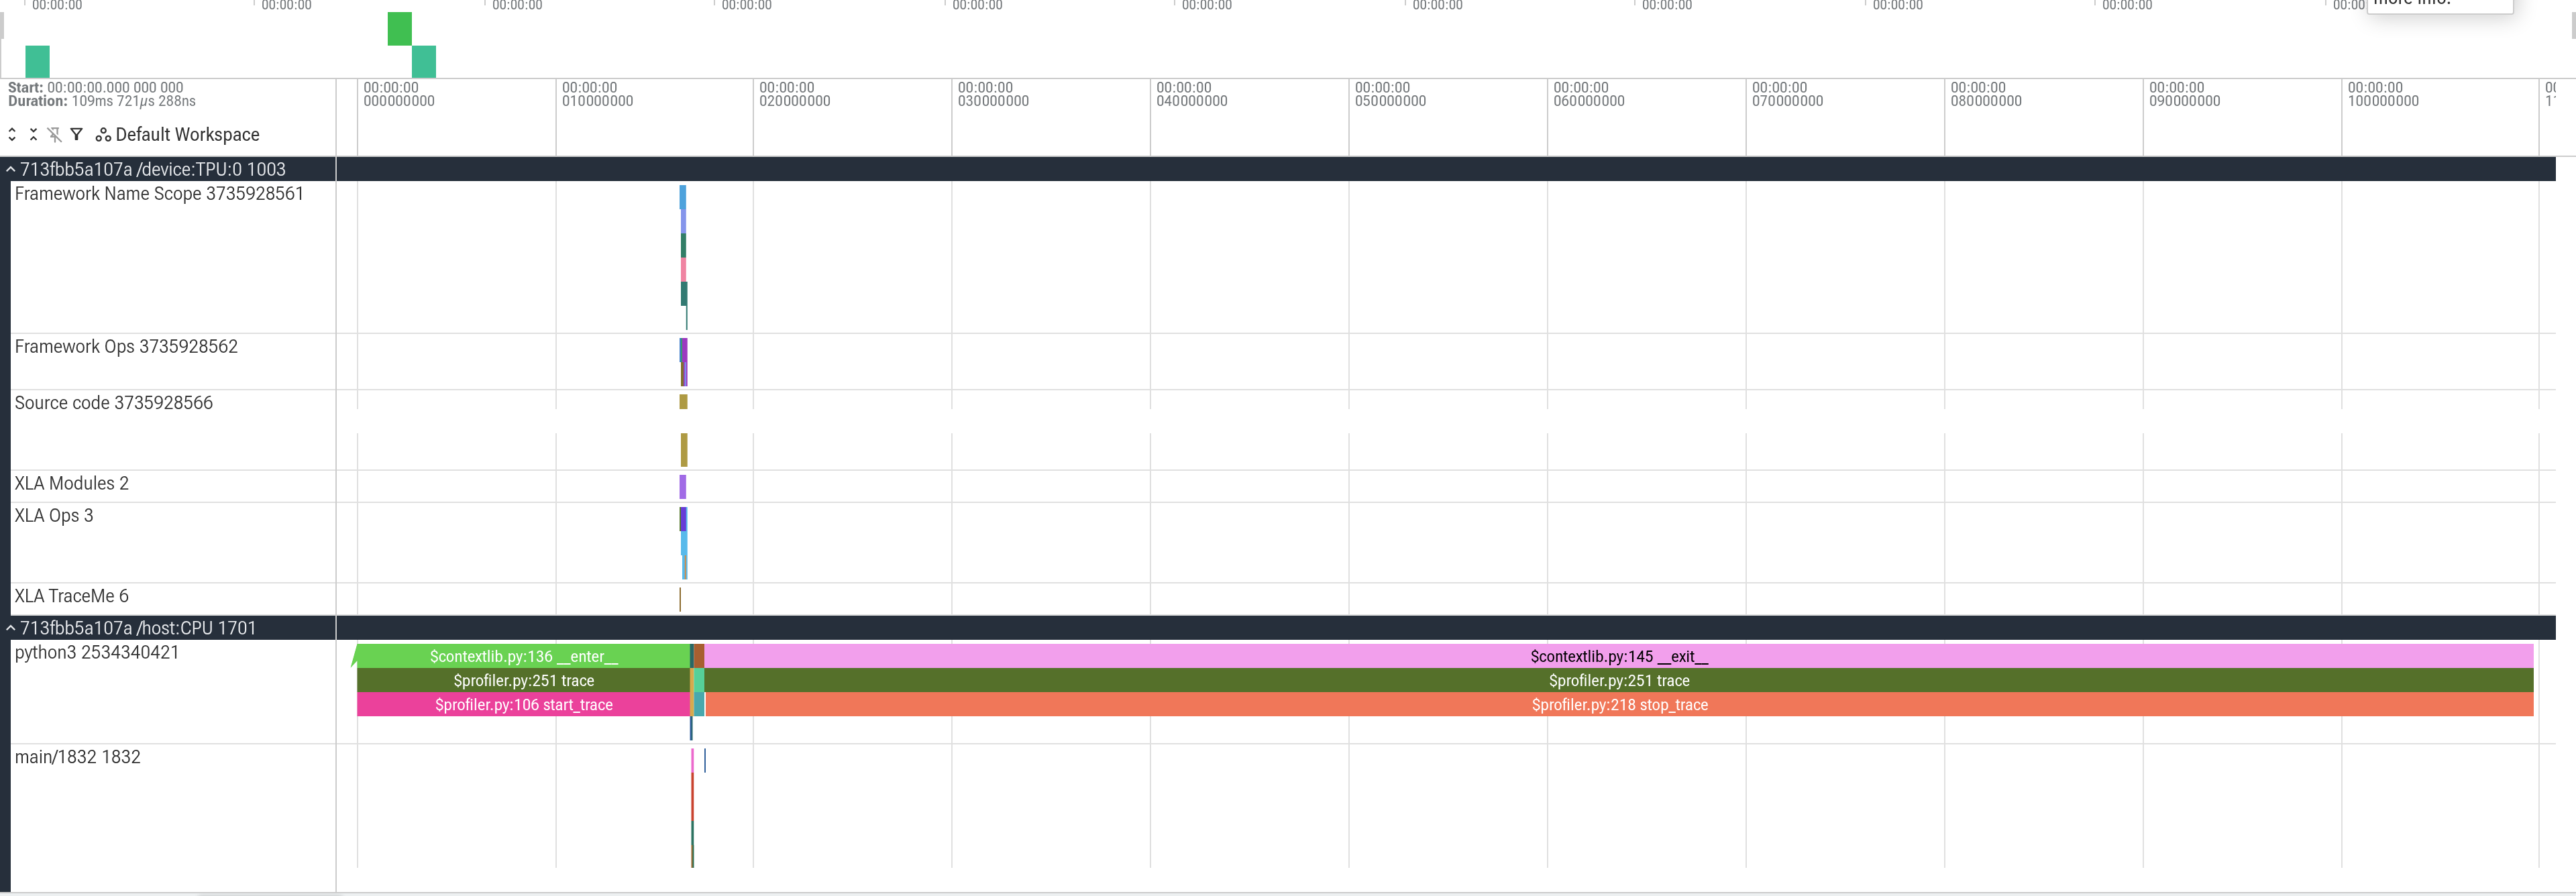
The text encoder, for contrast: 0.53 ms of device work inside a 110 ms window that is almost entirely host dispatch machinery. On the TPU this stage is not worth optimising.
6. The same GPU, two backends
§2 says the TPU is faster than the L4; it cannot say whether the
port is the reason. So both backends ran on one L4, same
checkpoint, same prompt, same seed, in separate
containers — JAX does not return GPU memory after
clear_caches(), so a single container that runs JAX first
OOMs torch's weight load.
| 120 s, L4 | generate | DiT (8 steps) | decode | conditioning |
|---|---|---|---|---|
| official torch, fp16 + FA2, chunked decode | 2544 ms | 1418 ms | 1059 ms | 21.5 ms |
| our JAX port, bf16, unchunked decode | 2218 ms | 1517 ms | 669 ms | 3.1 ms |
| ratio (torch / JAX) | 1.15× | 0.93× | 1.58× | 7.0× |
The port is faster than the official runtime on the same GPU, and the reason is structural rather than numerical: torch pays a fixed per-layer cost the JAX port fuses away. The clearest evidence is in torch's own numbers — going from T=388 to T=1358 latents (3.5× the sequence) costs its DiT only +44 % (0.988 → 1.418 s), because at these sizes a torch DiT layer is dominated by per-layer launch and mask-rebuild overhead rather than by arithmetic. Our fused 24-layer scan spends that time on FLOPs instead. The same effect shows at 5 s, where torch still needs 1046 ms against our 264 ms.
The one module where torch wins is the DiT itself at 120 s (1418 vs 1517 ms, 7 %), where Flash Attention and fp16 pull ahead once the sequence is long. Everywhere else the fused JAX graph wins, and the decode win is partly the chunked/unchunked difference and should not be read as a pure kernel result.
7. Scaling with duration
| audio | latents | TPU v6e-1 | L4 JAX | L4 torch | TPU vs torch | torch / JAX on L4 |
|---|---|---|---|---|---|---|
| 5 s | 120 | 44 ms | 264 ms | 1046 ms | 23.8× | 3.97× |
| 30 s | 388 | 104 ms | 559 ms | 1274 ms | 12.2× | 2.28× |
| 120 s | 1358 | 405 ms | 2218 ms | 2544 ms | 6.3× | 1.15× |
Three separate effects are visible. The TPU's advantage shrinks with duration from 23.8× to 6.3× because the short-duration rows are dominated by each runtime's fixed cost, and the TPU's is smallest. The port's advantage over torch on the L4 also shrinks — 3.97× at 5 s to 1.15× at 120 s — for the same reason, and it means the honest summary is "the port is much better at short renders and roughly level at long ones", not a single ratio. And the peak VRAM is flat across durations on the GPU side (5168 / 5186 / 5213 MiB for torch), so nothing here is capacity-bound.
8. What to optimize next
- Make
prepare_staticdevice-resident. It is 9.4 ms of the 405 ms — 2.3 % — and, per §4, most of the request's device idle. It is eager only because it validateslocal_add_condwith a host sync; for the all-zero (text-to-audio) case that check can be an assertion at trace time. - The decoder, not the DiT, is the second target on TPU. 236 ms — 1.56× the DiT — and growing faster with duration than the DiT does (16.8× from 5 s to 120 s against 7.2×). A chunked SAME-L path would cut activation memory and may fuse better.
- Compile is the cold-start cost, not the run. The shipping jit boundary compiles in 89–112 s on v6e-1; a persistent XLA cache makes subsequent processes skip it, which is what makes a kept Colab session worth its cost.
- Wire
mediumintopipeline. The single highest-value change is not performance at all:pipeline.generate(cfg=MEDIUM)currently returns wrong audio without raising.
9. What this does not establish
- No quality or parity claim. These runs measured
latency; no audio was scored, and no fixture comparison was made on
medium. A fast wrong answer and a fast right answer are indistinguishable here. - No scale-up. One v6e-1 chip, no mesh, no sharding. Nothing about 8 chips follows from this.
- Not like-for-like across frameworks. Chunked vs unchunked decode and fp16+FA2 vs bf16 are differences in what was computed, stated in §1 rather than normalised away.
- Torch's short-duration rows carry a real error bar. Across three L4 runs, 120 s was reproducible (2.31–2.54 s) but 5 s and 30 s varied 0.76–1.05 s and 0.98–1.27 s.
- The trace windows are profiler-inflated. The traced
generateiteration measured 2627 ms against a 405 ms warm call. The traces are used for structure and device-busy attribution, and the busy column is quoted because it independently reproduces the harness latency — never for latency itself.
Where the numbers come from
| artifact | path |
|---|---|
| TPU driver | scripts/tpu_medium.py (Colab v6e-1, prep →
profile) |
| L4 JAX | scripts/modal_jax_medium.py →
out/l4-jax/medium-profile.json |
| L4 torch | scripts/modal_torch_medium.py →
out/l4-torch/medium-profile.json |
| merged table | scripts/consolidate_medium.py →
out/medium-latency.{json,md} |
| roofline vs measured | scripts/roofline_medium.py →
out/medium-roofline.{json,md} (imports
flicker/tools/roofline.py, the model behind the roofline
report) |
| XProf → Perfetto | scripts/xplane_to_perfetto.py (Sail Research's gist,
transmissions11/0de193188187a1a590a669fbcde26240, factored
into a CLI) |
| busy/idle | scripts/trace_busy.py →
out/tpu-medium/busy.json |
| figures | scripts/trace_shots.py +
scripts/perfetto_shots.mjs,
scripts/make_medium_figures.py |
TPU runs are reproducible to 0.7 %: the two independent 120 s runs
gave 402.3 ms and 405.0 ms. Parameter counts confirm the checkpoint
loaded is the one intended — DiT 1,453,170,192, conditioner 198,144,
text 281,580,288 — and the decoder's 426,063,089 resolves a documented
ambiguity: new_tokens is stored (1, 1, 1536),
not (1, 16, 1536).
Four engineering notes worth keeping, each of which cost a wrong figure first.
The conversion is the Sail gist's, verbatim — one
xspace_to_tool_data([path], "trace_viewer@", {}) call and a
gzip.compress. Verified against the gist's own code on the
same .xplane.pb: identical event count, identical
event-name multiset, identical process_name metadata.
Its output is not byte-reproducible, so a digest is not an
identity check. Two calls on the same input — even within one
process — permute stack-frame ids and HLO op names
(%copy.1703 ↔︎ %copy.1808) while preserving
length and every op name. Compare traces by their event-name multiset,
never by hash.
The screenshots are produced by rewriting the trace to the
window, because deep-link zoom does not take effect in headless
Chromium. The crop must keep metadata events: they
carry no timestamp, so a naive clip drops every
process_name, and Perfetto then reports hundreds of
unmatched-track import errors and labels the tracks "Process 1003".
Preserving them is what puts /device:TPU:0,
/host:CPU and the Source code track in the
figures above.
Zoom depth is set in microseconds, not as a fraction of the stage, and the reason is the number in §5: 600 ops/ms on the DiT means a 20 ms window cannot label anything. Size the window so the slices are wide enough to carry text, or the figure looks like a texture.