944 → 346 ms: optimizing FLUX.2 klein-4B on one TPU v6e chip
FLUX.2 klein-4B, raw JAX, bf16, 1024², batch 1, 4 Euler
steps, text encoder and VAE included, all weights resident on
one Colab TPU v6e-1 (32 GiB, 918 TFLOP/s bf16
datasheet, 1.64 TB/s). From a frozen baseline of 944.67
ms to 345.9 ms per image —
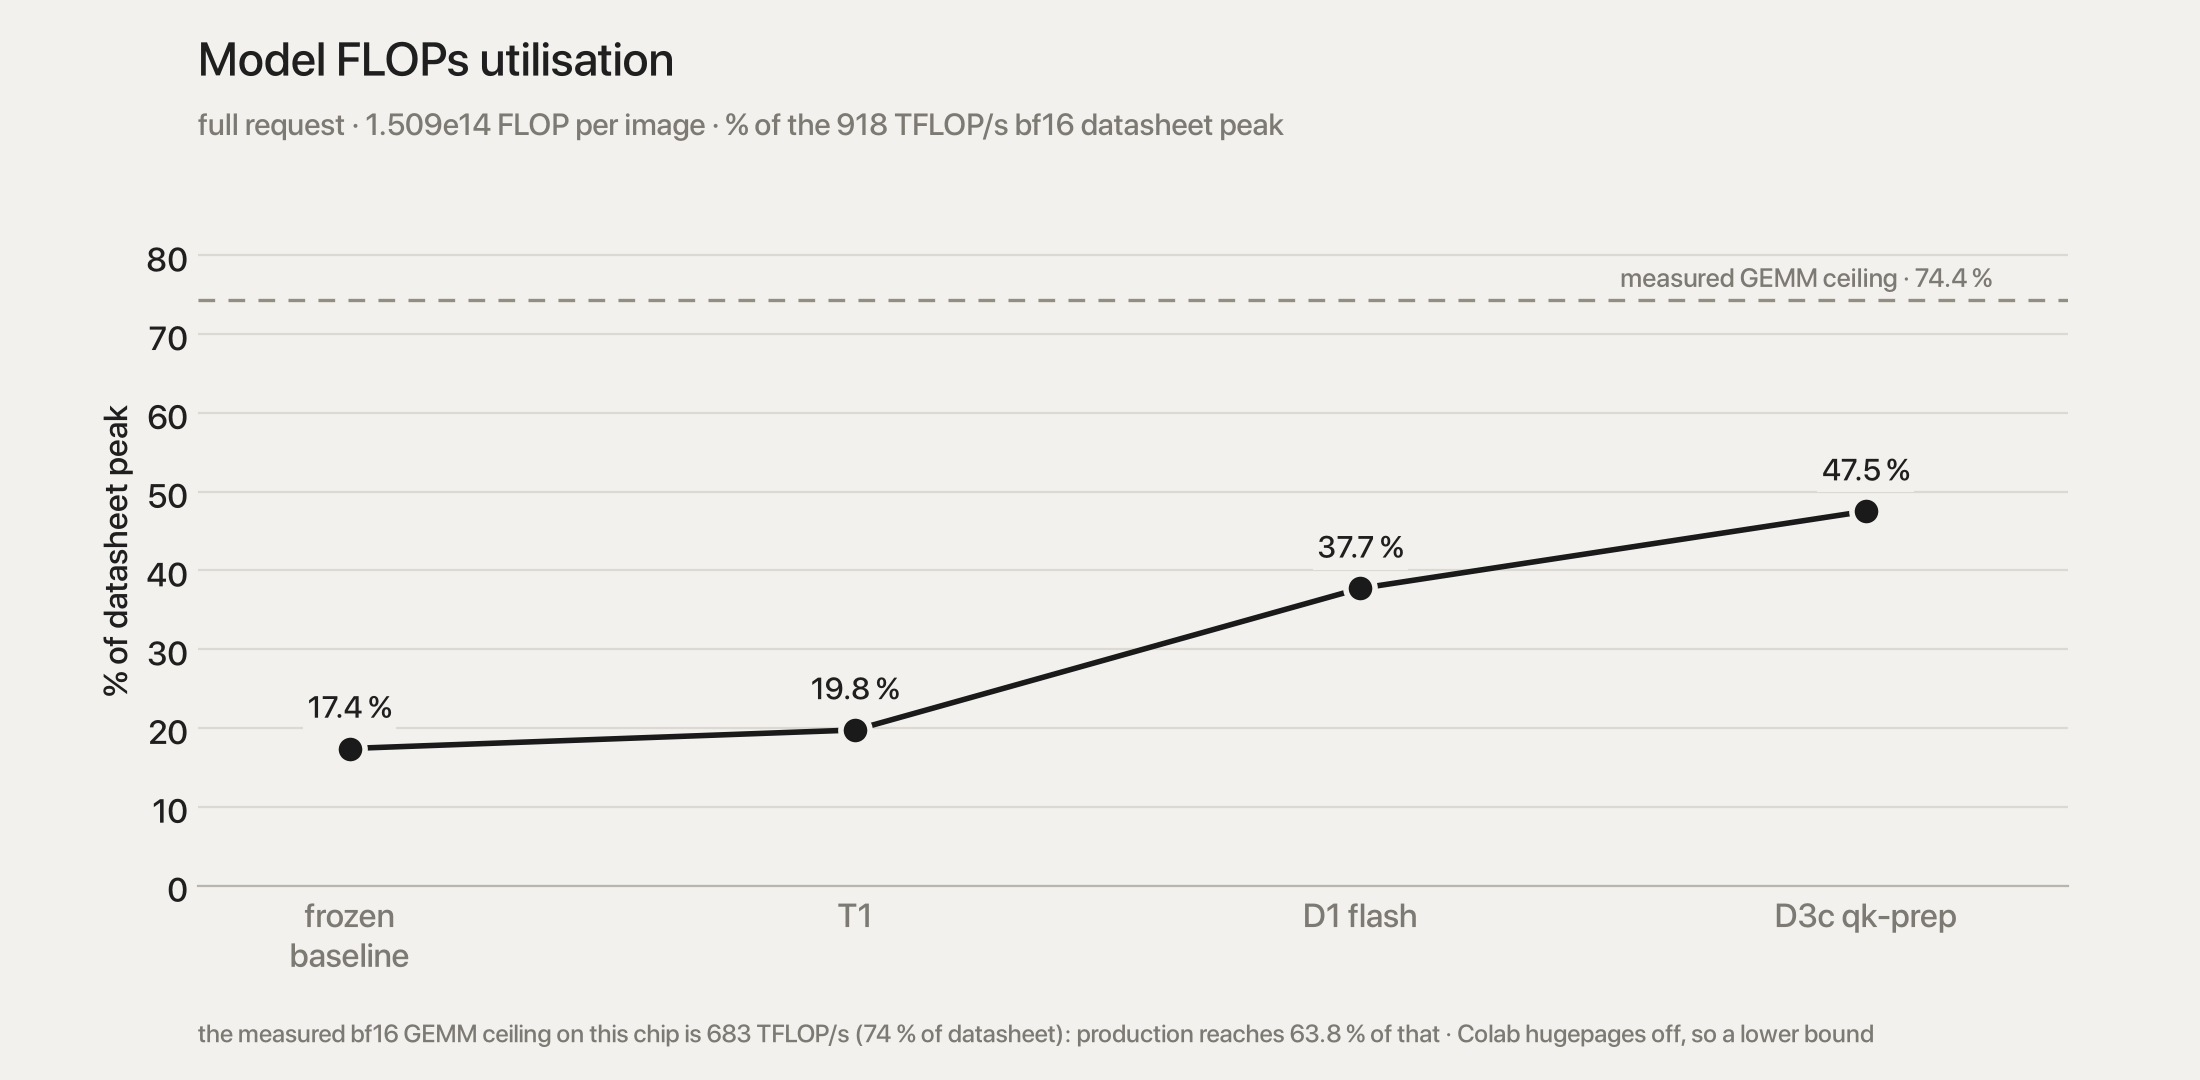
2.73×, 1.06 → 2.89 img/s, 17.5 % → 47.5 % datasheet MFU
— with every kept step gated against the PyTorch oracle. Every number is
a warmed p50 around jax.block_until_ready(), and every A/B
ran old and new code in the same session. Tags: [M] measured,
[D] derived, [S] spec.
1. Result
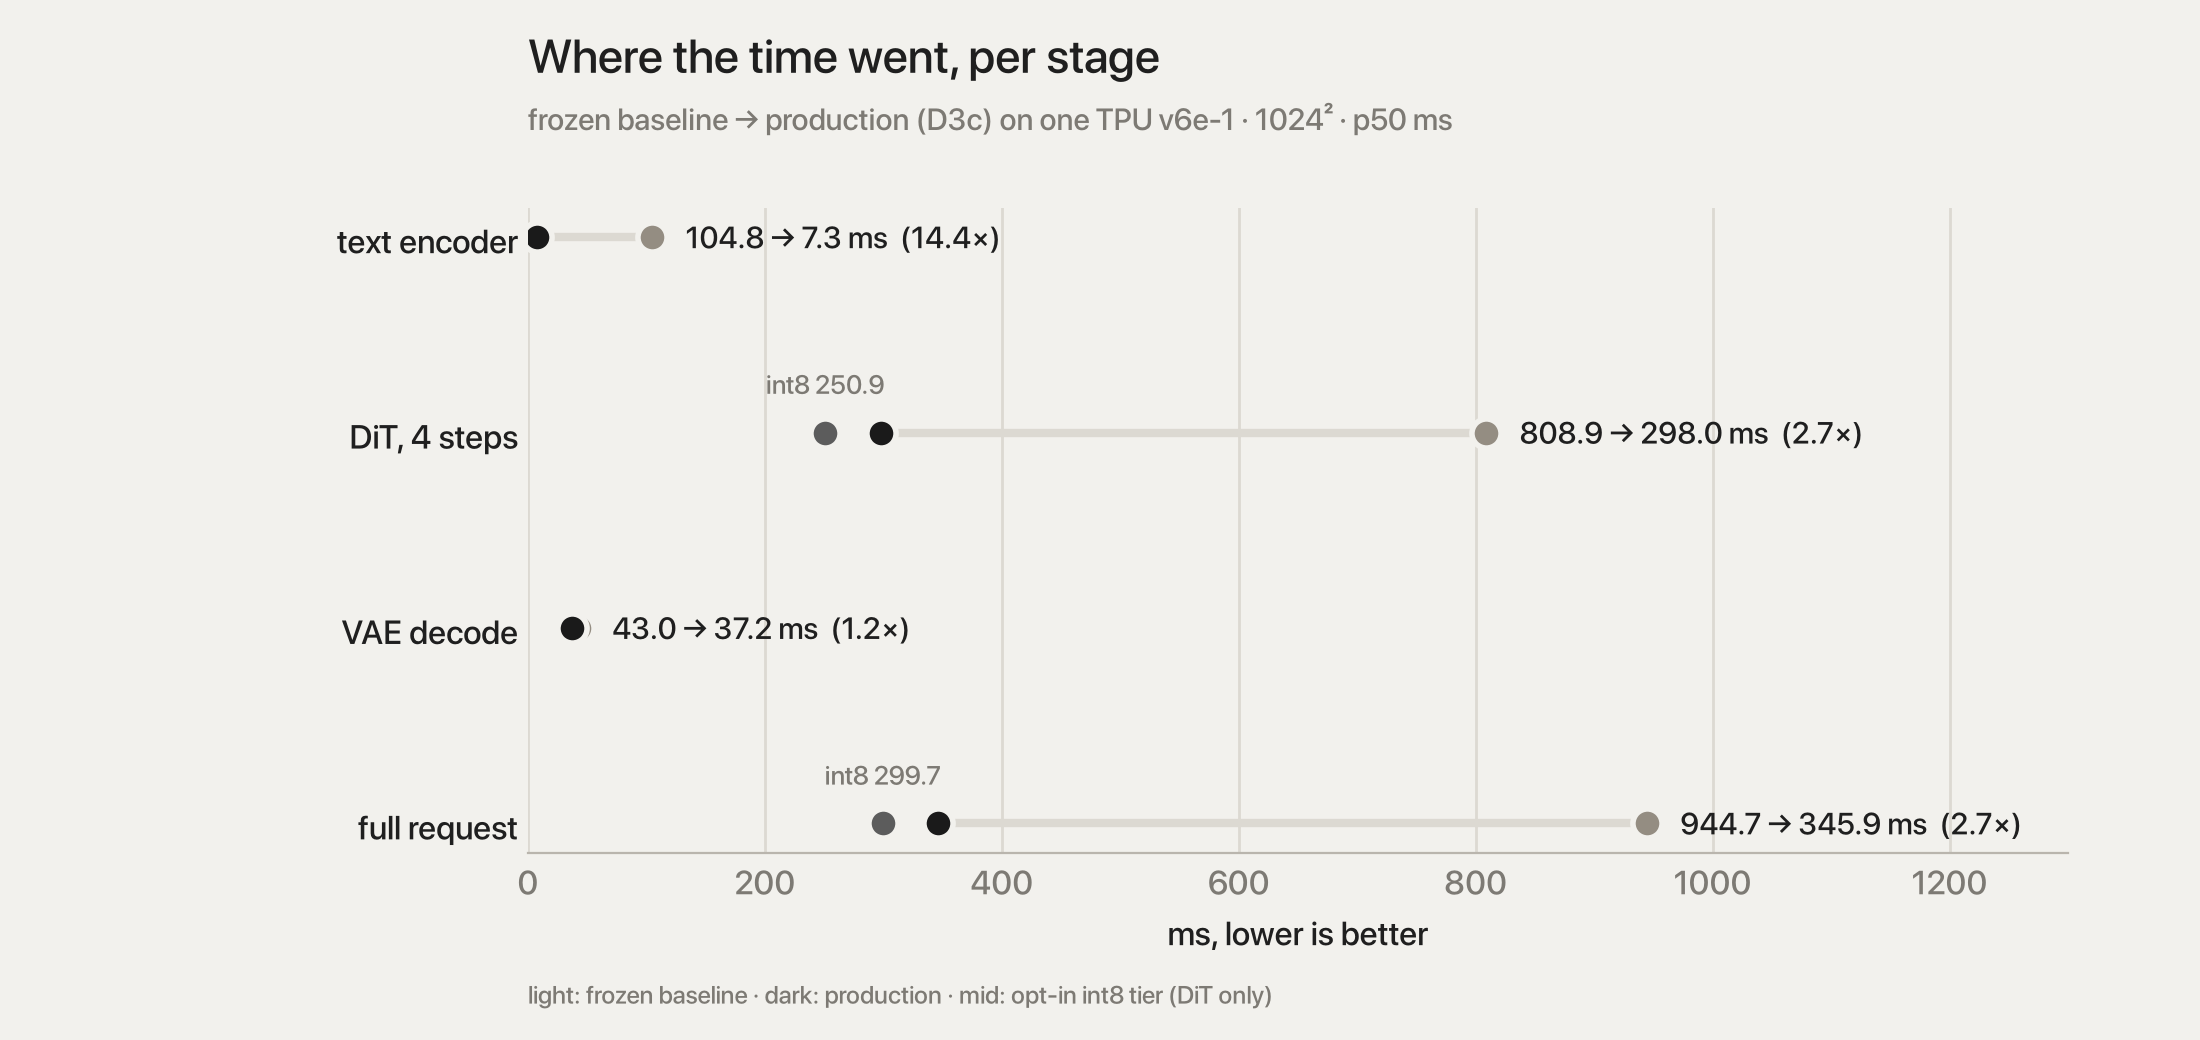
| stage | request p50 | text | DiT (4 steps) | VAE | img/s | vs baseline |
|---|---|---|---|---|---|---|
| frozen baseline | 944.67 ms | 104.81 | 808.92 | 42.98 | 1.059 | — |
| T1 residency + one scan | 832.21 ms | 7.41 | 784.04 | 37.54 | 1.202 | 1.135× |
| D1 flash attention | 435.7 ms | 7.4 | 387.7 | 37.5 | 2.295 | 2.17× |
| D3c fused qk-prep kernel | 345.9 ms | 7.3 | 298.0 | 37.2 | 2.891 | 2.73× |
notes: [M]. Latest production: 436.3 TFLOP/s achieved, 47.5 % of the 918 datasheet peak and 63.8 % of the 683 TFLOP/s a chain of 8192³ bf16 GEMMs actually reaches on this chip; the device is busy 98.8 % of the request.
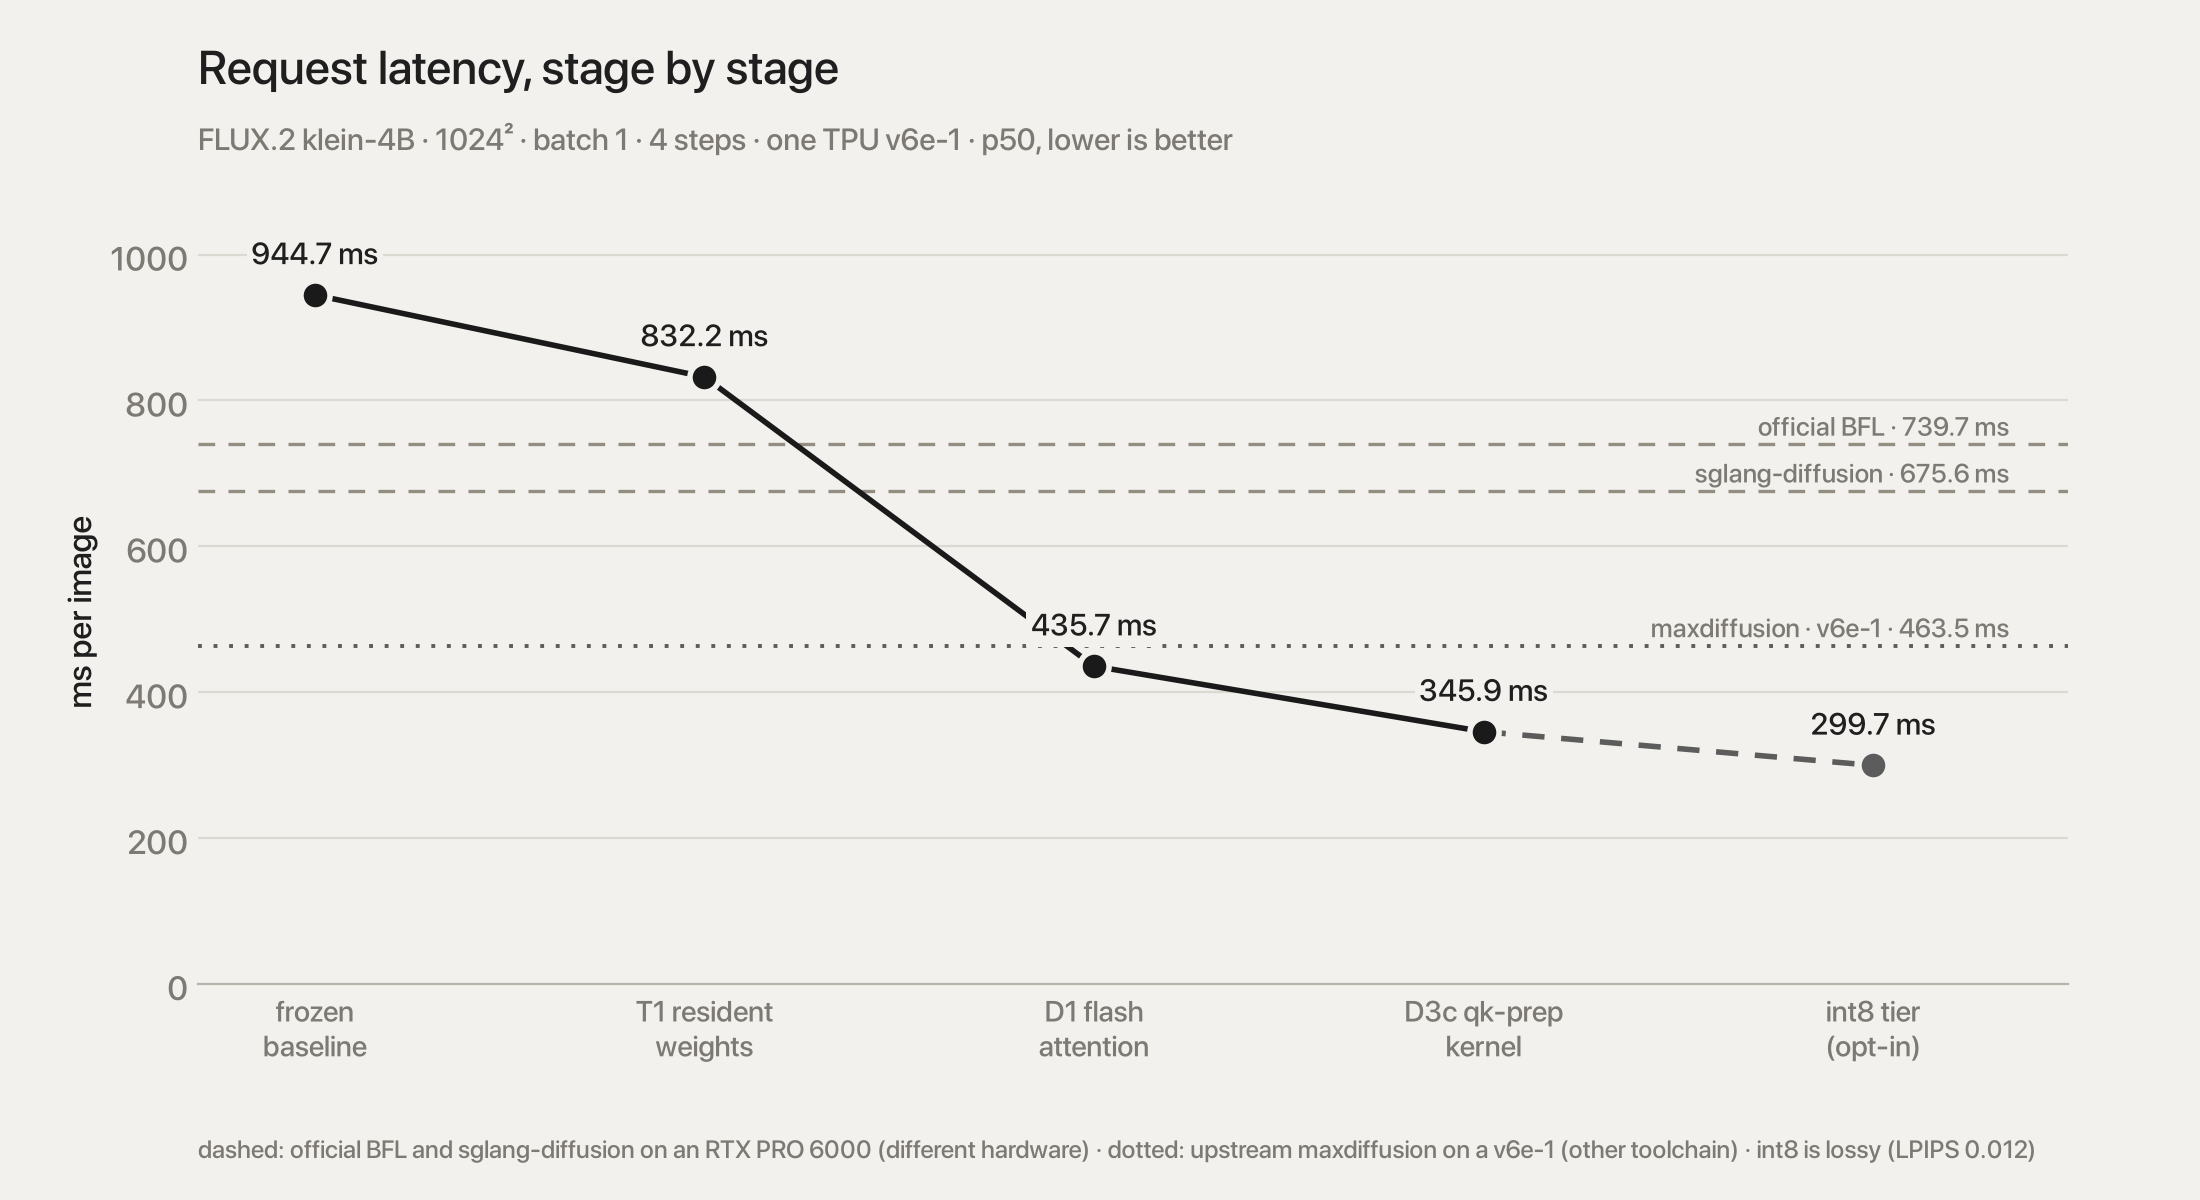
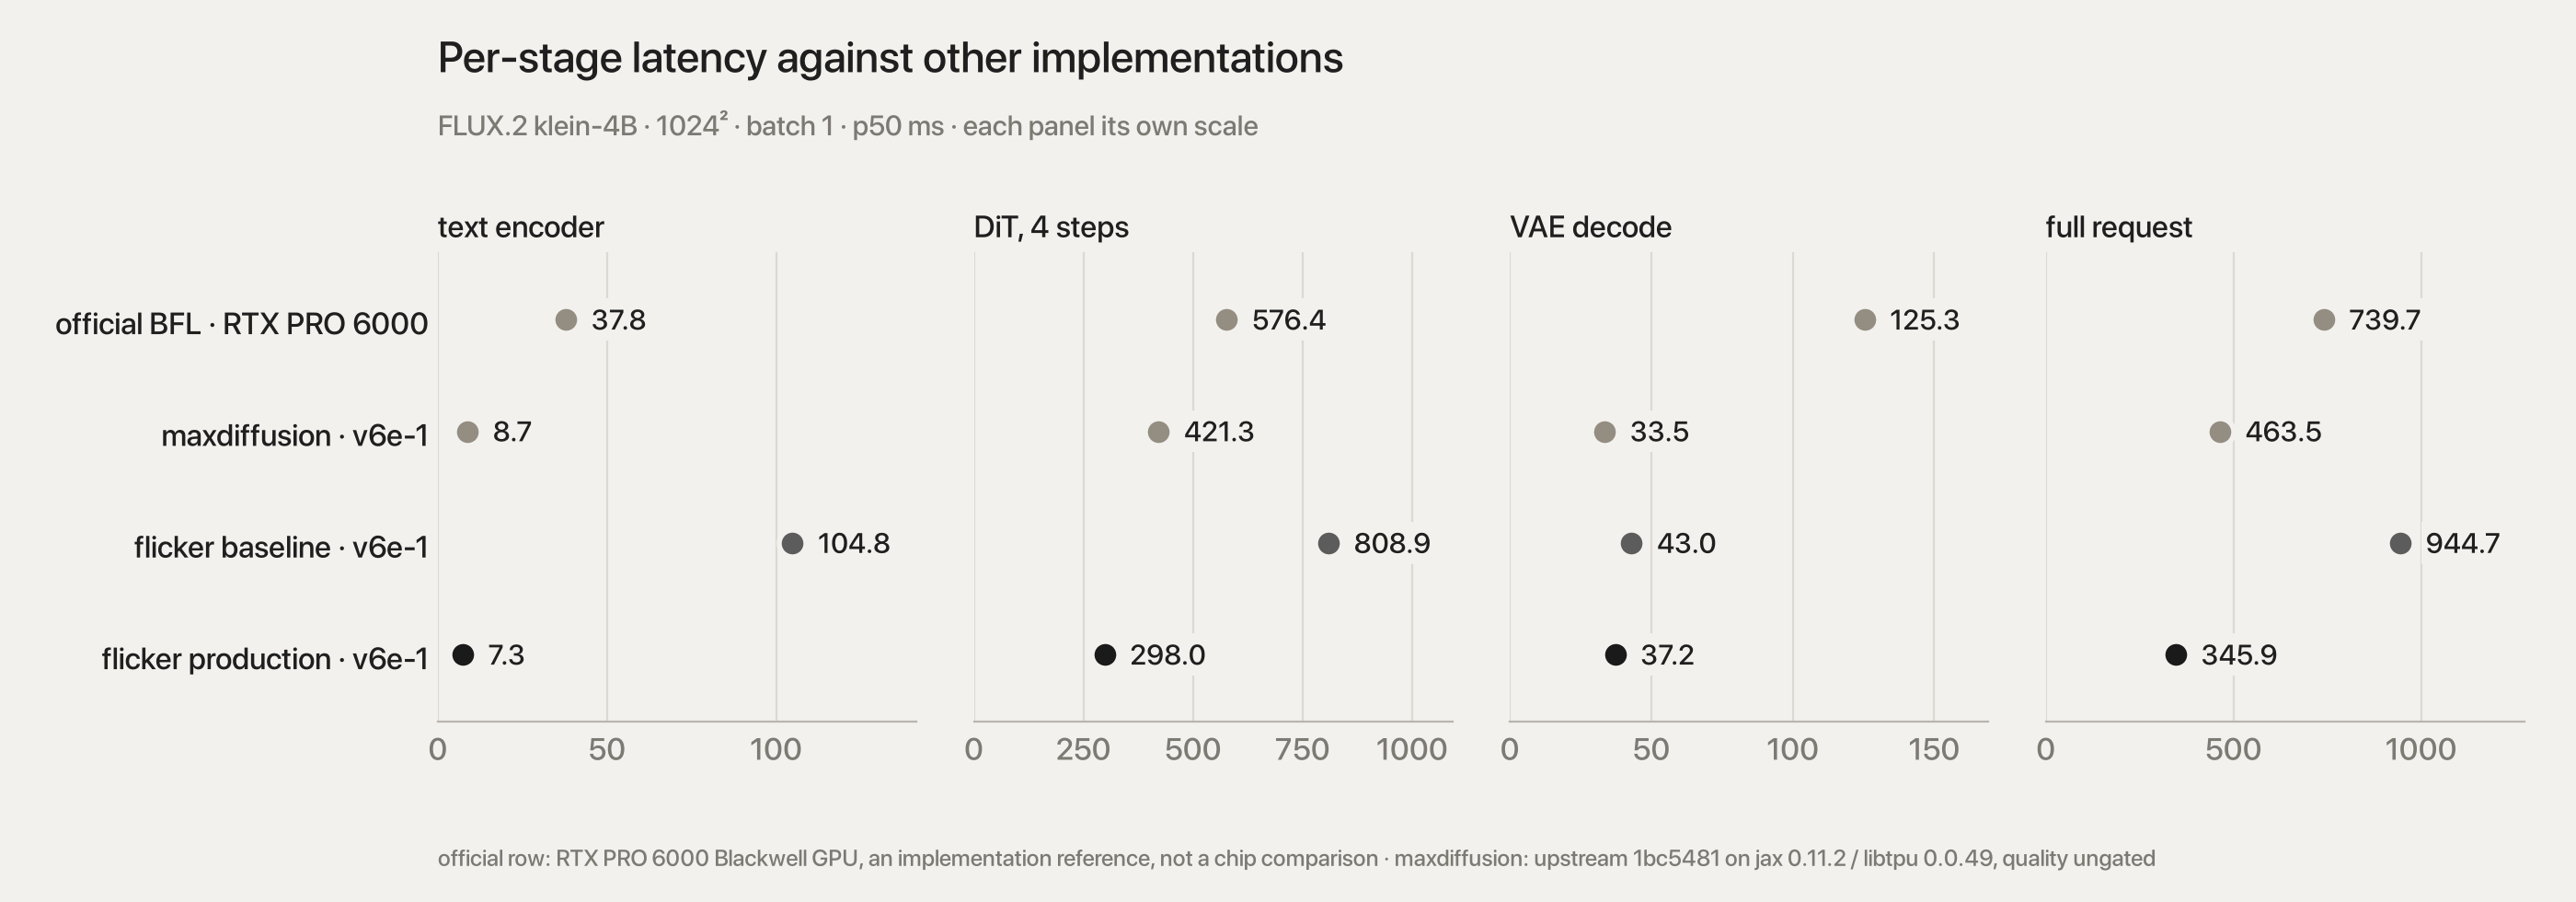
For scale, on an RTX PRO 6000 Blackwell (different hardware — an implementation reference, not a chip comparison): sglang-diffusion 675.60 ms, BFL's official repo 739.72 ms [M].
On the same chip type, upstream maxdiffusion
(Google's JAX port, commit 1bc5481, unmodified, its shipped
splash-attention config) runs the same request in 463.5
ms — text 8.7 / DiT 421.3 / VAE 33.5 ms, p50 of 20 reps [M].
flicker is 1.34× faster, all of it in the DiT (298.0 vs
421.3 ms); their VAE decode is 3.7 ms faster than ours. Not a
same-session A/B: maxdiffusion ran on jax 0.11.2 / libtpu 0.0.49,
flicker on jax 0.7.2 / libtpu 0.0.23, and its quality was not gated
(Appendix B, 2026-10-01).
1b. Same chip, same session: flicker vs maxdiffusion at 512² and 1024²
Both engines back to back in one v6e-1 session, same prompt, same timing boundary (text + denoise + VAE, p50 of 20 reps), each on its own toolchain [M].
| batch 1 | flicker | maxdiffusion (best setting) | maxdiffusion (shipped flash) |
|---|---|---|---|
| 512² | 95.3 ms · 10.5 img/s | 112.2 ms · 8.9 img/s | 149.7 ms · 6.7 img/s |
| 1024² | 343.0 ms · 2.9 img/s | 462.9 ms · 2.2 img/s | 462.9 ms |

flicker is 1.35× faster at 1024² and 1.18× at 512² (1.57× against maxdiffusion's shipped config). The gap is the DiT; text and VAE are level at 512².

At 512² maxdiffusion's flash attention is slower than its own dot-product (132.7 vs 95.2 ms): its block stays 4608 rows for a 1536-token sequence. It also fails to compile above batch 1, so the batch curves below use its dot-product path.


Batching buys nothing at 512² either: flicker's batch 8 equals batch 1 (10.5 img/s), maxdiffusion peaks at batch 1.
2. The two inference paths
| stage | official (BFL, PyTorch) | this port (JAX, TPU) |
|---|---|---|
| tokenizer | HF AutoTokenizer, chat template |
Rust tokenizers, same template byte-for-byte, host
numpy |
| text encoder | HF Qwen3ForCausalLM, 36 layers,
output_hidden_states |
27 layers only (taps 9/18/27), one
lax.scan, taps from ys |
| conditioning | (1, 512, 7680) = hidden states 9 ‖ 18 ‖ 27 |
same, padding kept unmasked |
| DiT attention | torch SDPA (flash kernel on GPU) | Pallas flash attention, tiles q 2304 / k 1536 |
| q/k/v prep | separate ops | one Pallas pass: head transpose + QK-RMSNorm + rope |
| DiT loop | 4 Python-level Euler steps | 4 steps in one lax.scan, 5 double + 20 single blocks
scanned |
| VAE | diffusers AutoencoderKLFlux2 decoder |
same decoder, NHWC, hand-written ops |
| weights | loaded per process | all 13.3 GB resident as device arrays |
Numerics are matched cast point for cast point (fp32 RMSNorm → bf16 →
× bf16 scale; fp32 rope → bf16; bf16 1000·t; bf16 Euler
step; truncating uint8 conversion). Parity: 16-rung ladder 0
FAIL on L4 and on v6e-1 [M].
3. How the latency hid
wall = device-busy + device-idle
       ├─ compute-bound  (limited by FLOP/s)
       └─ memory-bound   (limited by bytes/s)
                           └─ host work, H2D copies, dispatch, waits
Three questions decided every step: (1) is the device idle (occupancy = busy ÷ wall)? (2) for busy time, is each op compute- or memory-bound — achieved FLOP/s and bytes/s against the ridge, 683 / 1.64 ≈ 420 FLOP per byte? (3) does the fix change numerics — then gate it; if not, prove bit-identity.
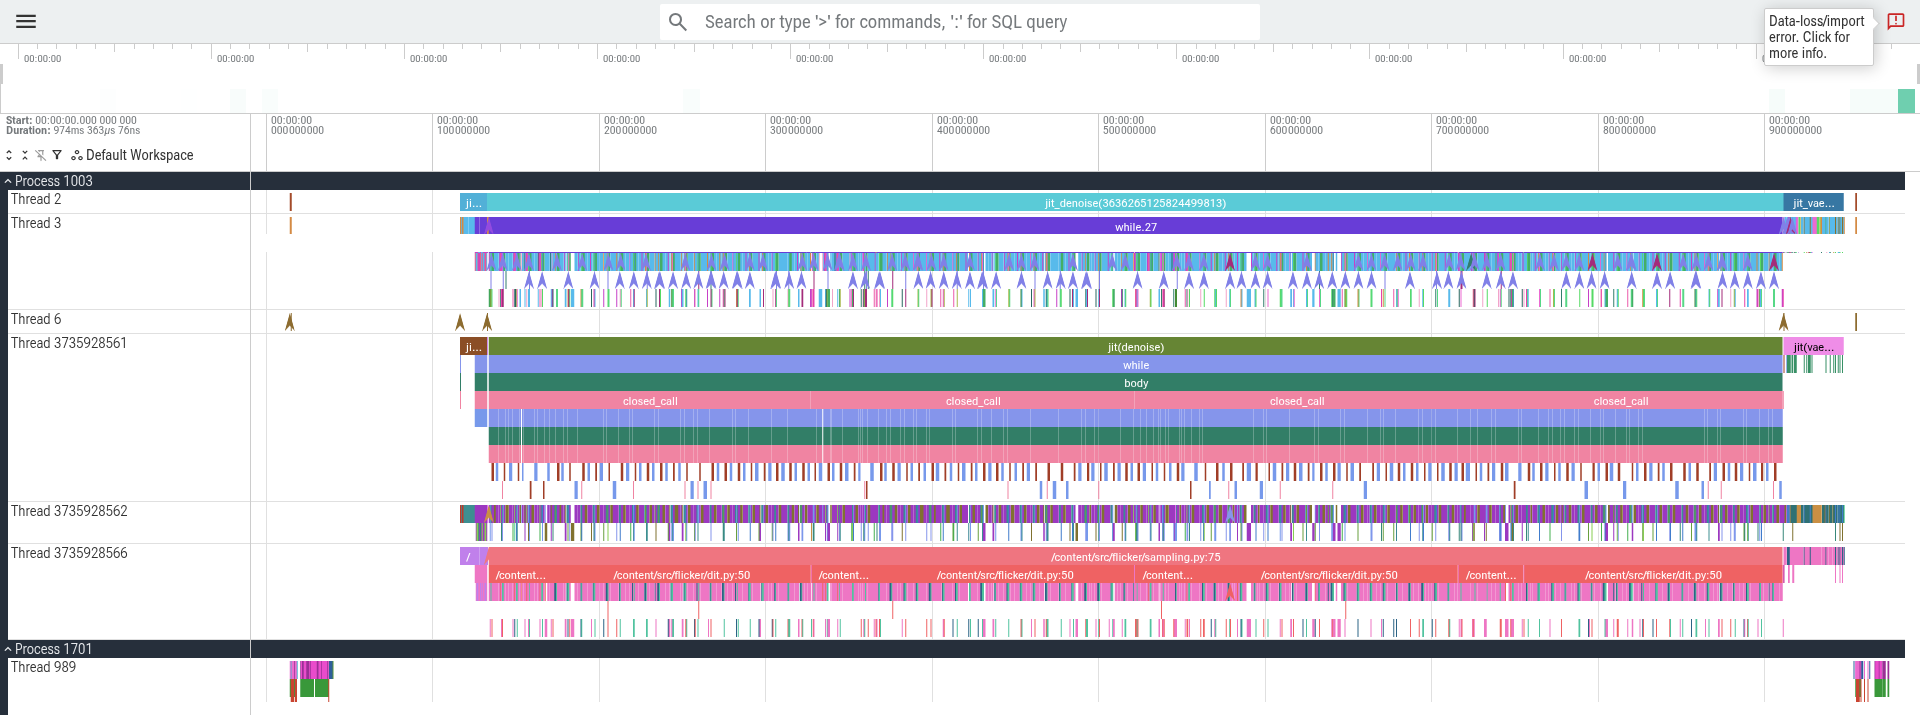
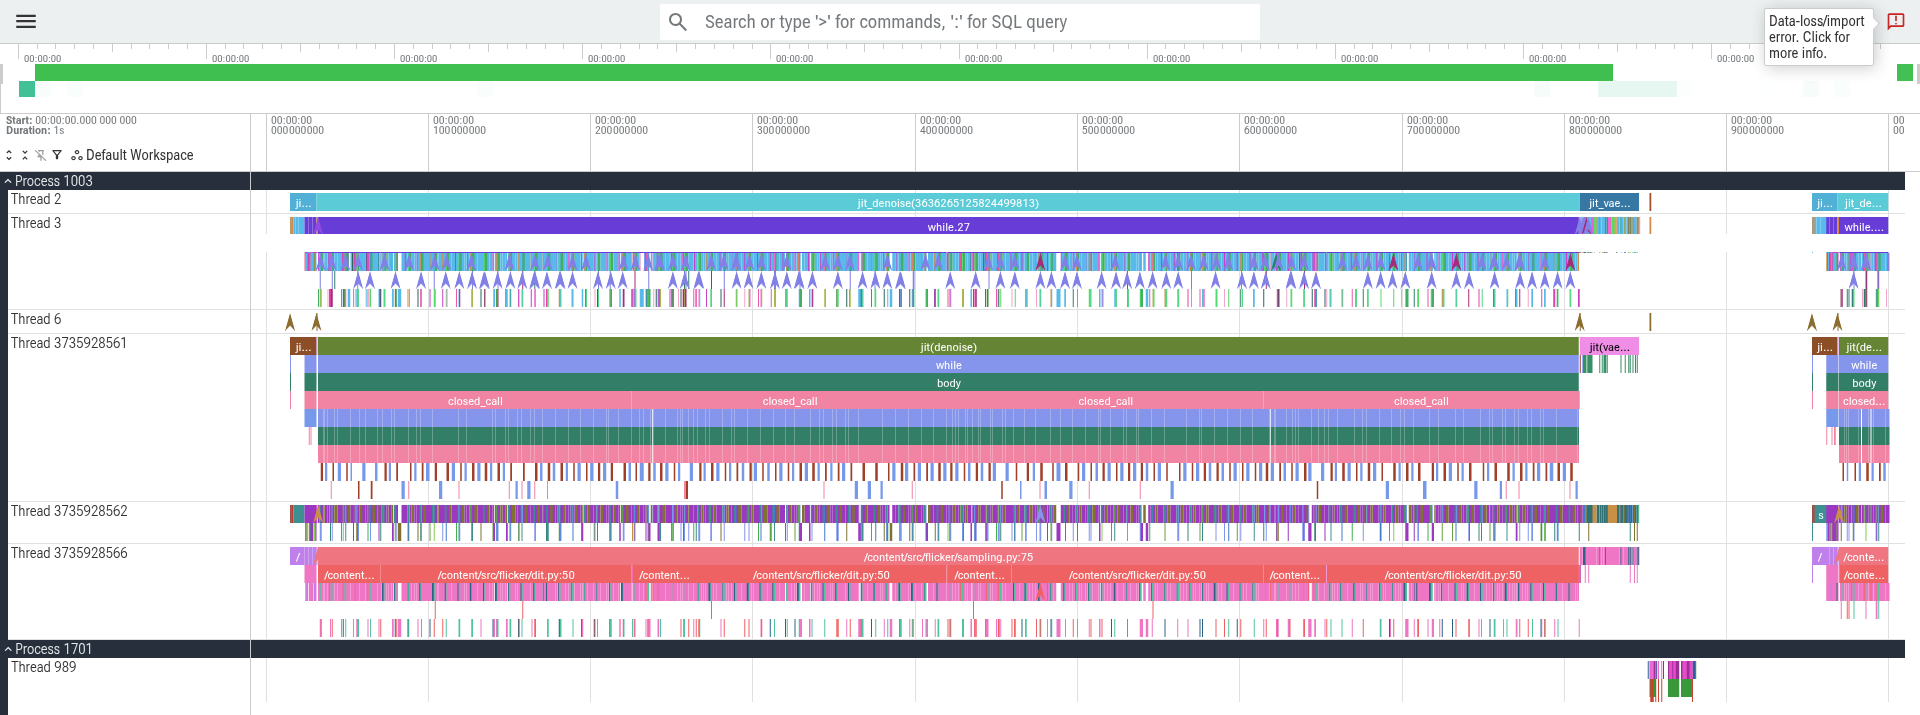
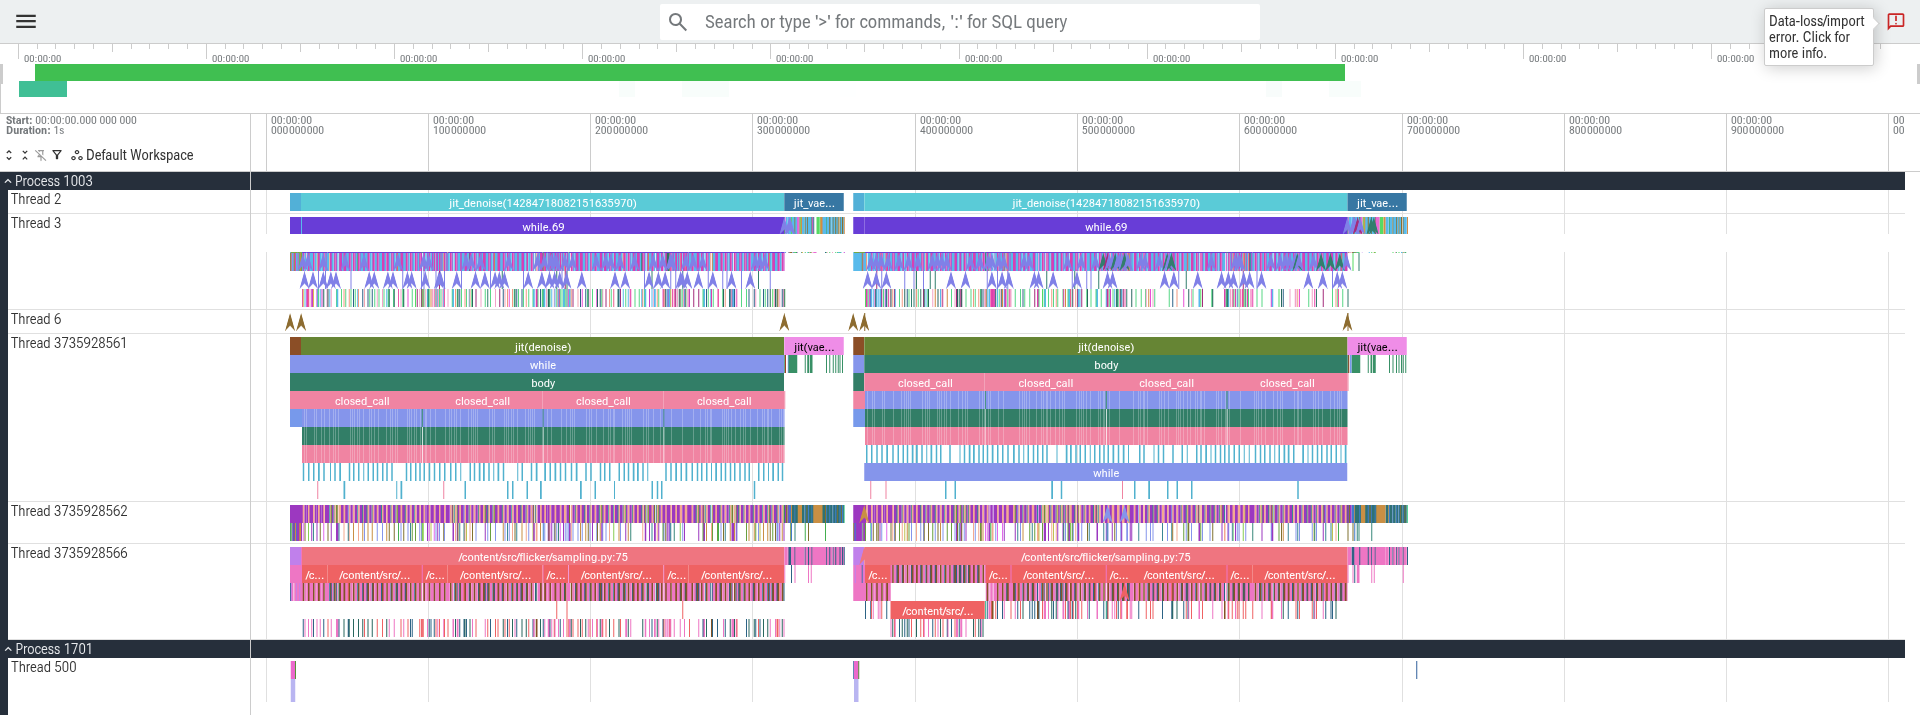
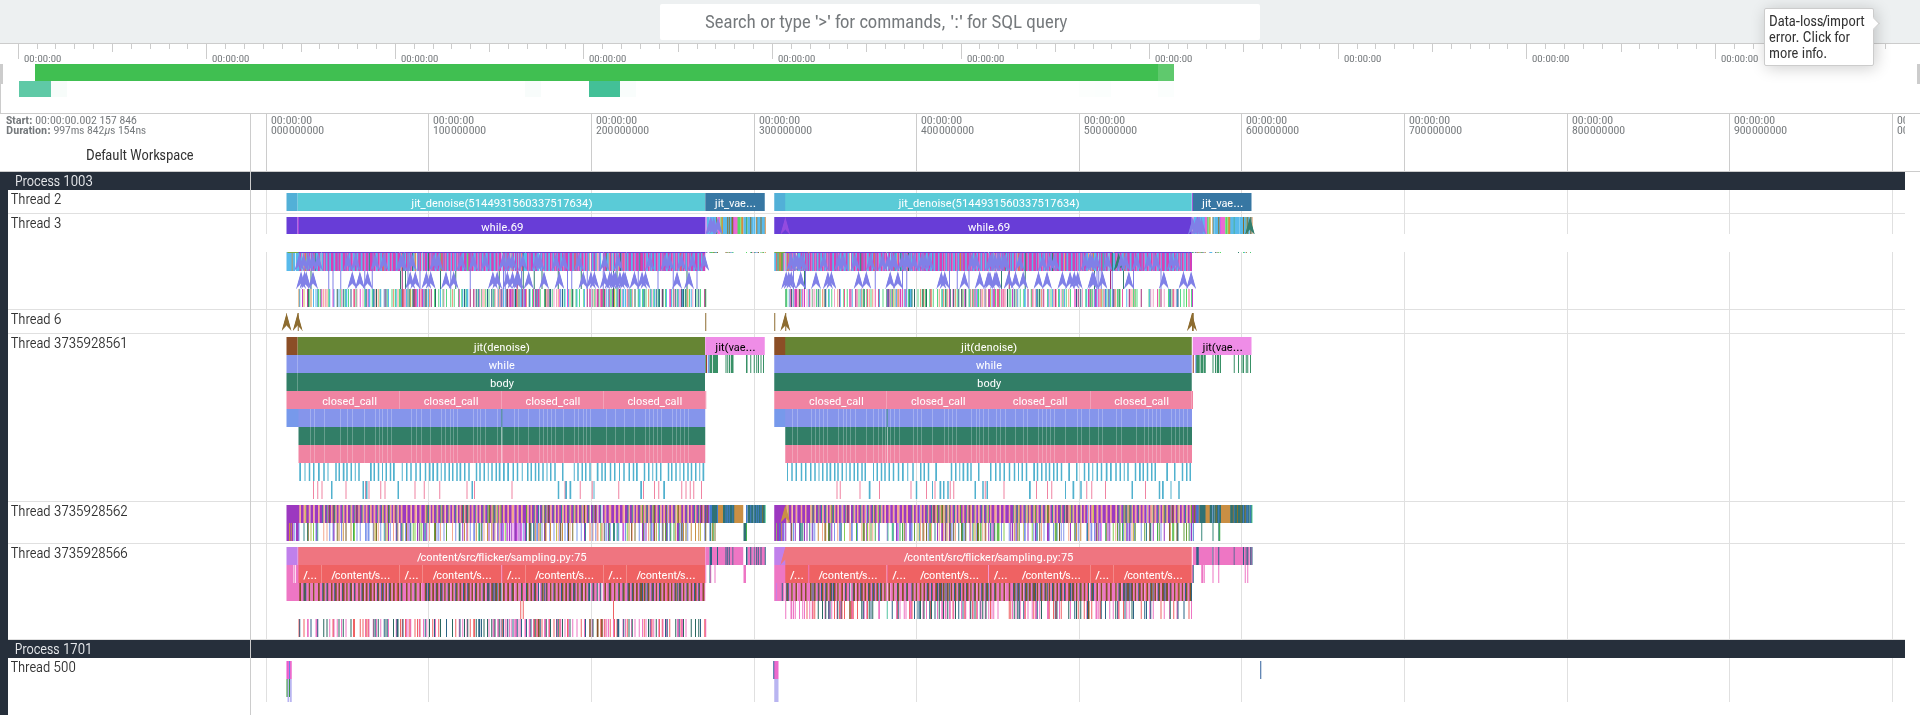
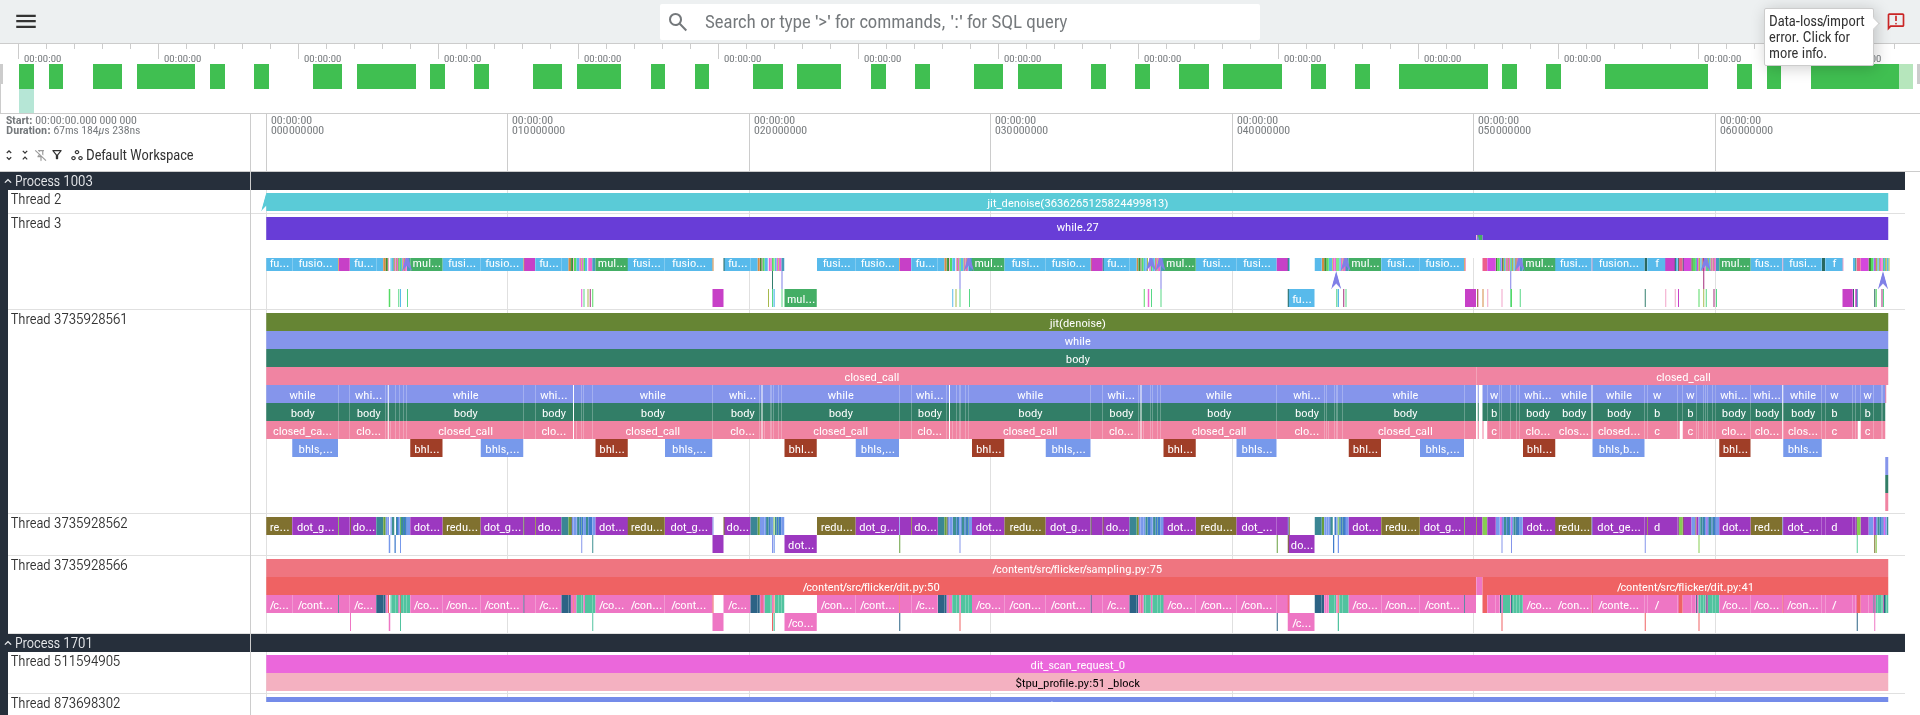
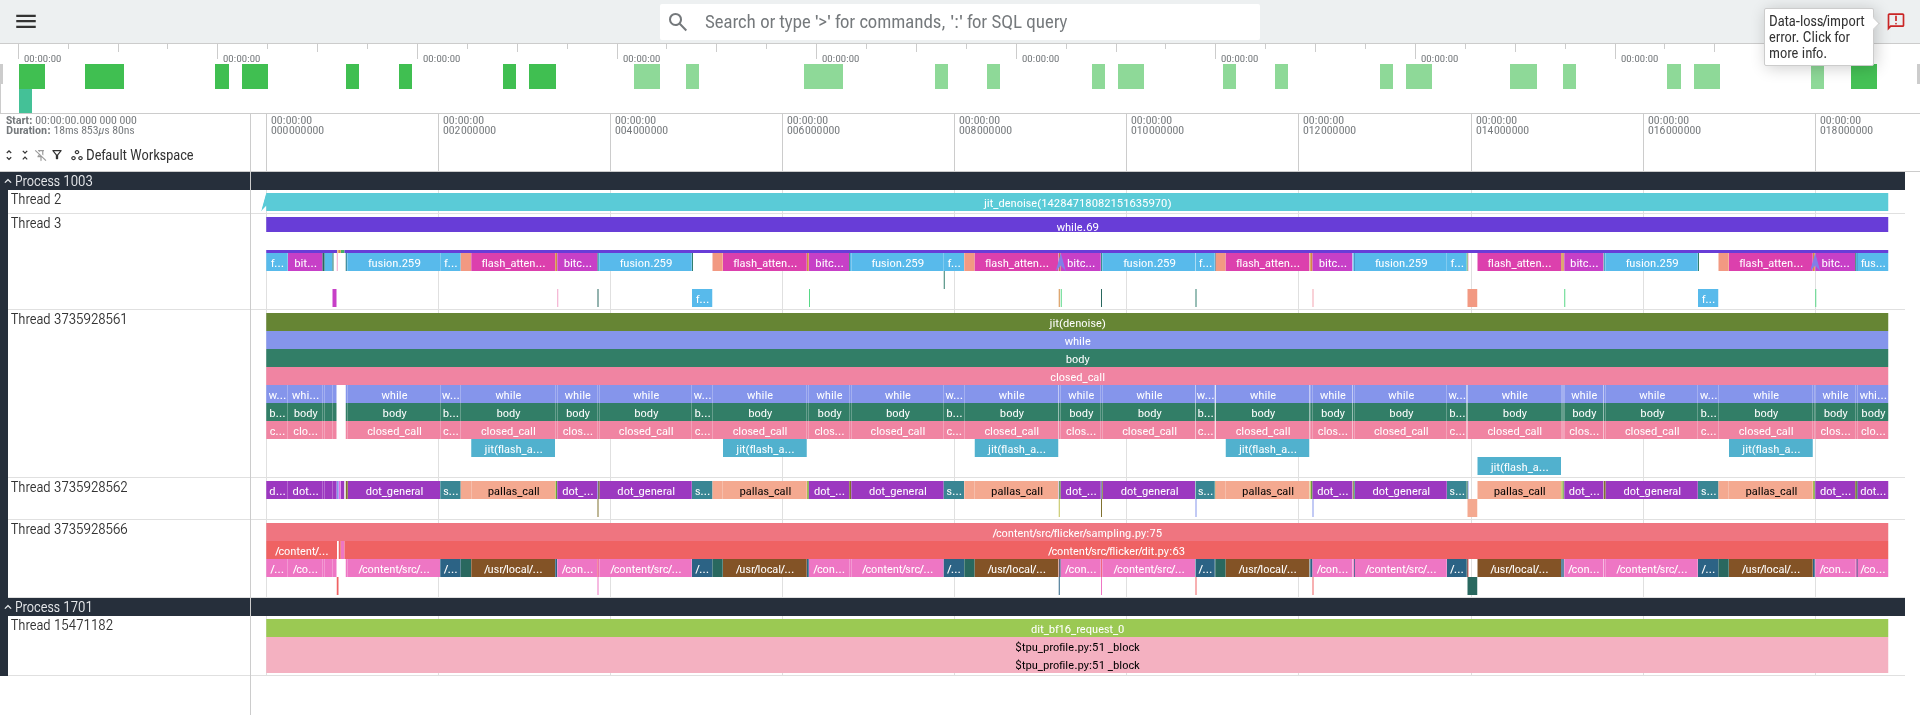
Before and after, one second each. The same 1000 ms window from the first text encode, same scale: the frozen baseline fits one request; production bf16 fits two with room to spare; the int8 tier two shorter ones.
3b. The TPU facts that picked the fixes
Each property below is a v6e fact that ruled a candidate in or out — the same idea (fuse, quantize, batch) lands differently on a GPU.
| v6e property | consequence here | decision it drove |
|---|---|---|
| One TensorCore, one MXU (256×256 systolic array, bf16 in / fp32 accumulate) fed by a vector unit; no thousands of threads to hide latency [S] | latency is hidden by DMA prefetch into VMEM, not by switching warps; each tile must carry enough MXU work to cover the next tile's copy | large attention tiles (q 2304, k 1536); 128×128 tiles were 3× slower than naive |
| Large on-chip VMEM (tens of MiB per core, vs ~100-200 KB shared memory per GPU SM) [S] | tiles 10× the size GPU flash kernels use fit on chip | flash/splash with 1536-2304-row tiles; qk-prep holds a whole
(rows, 128) head tile |
| Vector registers are 8 sublanes × 128 lanes [S] | a trailing axis of 2 (rope pairs) or 1 wastes most of each register and forces relayout copies | rope as two (L, 128) tables and a lane rotate
(pltpu.roll), never a (…, 64, 2) view |
| Mosaic compiles Pallas kernels to 2-D tiles only [M] | strided lane slices lower to an unsupported gather; 3-D in-register transposes are rejected | kernel layout work goes into BlockSpec index maps —
the DMA does the head transpose for free |
Grid steps run sequentially on the core, a
BlockSpec addresses whole blocks [S] |
grid order is a loop, not parallelism; index maps return block indices | batch became one more grid axis at no cost; an offset-vs-block bug corrupted only grids ≥ 3 steps |
| Ridge ≈ 420 FLOP/byte (683 TFLOP/s measured / 1.64 TB/s) [D] | anything under ~420 FLOP/B waits on HBM: softmax at ~1 FLOP/B, rope at 0.25 TFLOP/s | fuse memory-bound chains (flash, qk-prep) rather than speed up math |
| DEFAULT precision runs fp32 matmuls as a bf16 MXU pass [M] | nn.sdpa's fp32 upcast of q/k/v doubled bytes and bought
no precision |
dropping the upcast (in the flash kernel) cost 0 dB |
| int8 MXU mode, up to 2× the bf16 rate [S] | only realised on large GEMMs (1.6-1.7× at 4096-4608 rows × 18-27 K columns; ~1.0× elsewhere) [M] | int8 restricted to the two large GEMMs; the rest stay bf16 |
| 32 GiB HBM, one chip [S] | all 13.3 GB of weights fit resident; no collectives at all | resident serving; batch 1; no sharding study needed |
| Host → device over PCIe at ~8.4 GB/s measured, dispatch asynchronous [M] | a per-call NumPy weight costs its size ÷ 8.4 GB/s, invisible to host timers | every weight a device array at load (T1) |
| XLA is the fuser, and it fuses elementwise chains but not reductions + lane permutes + transposes into one pass [M] | layout rewrites at the XLA level move bytes between ops, they do not remove them | a Pallas kernel, not a fourth XLA rewrite, for the q/k/v prep |
| jax and libtpu are a matched pair [M] | Colab ships jax 0.7.2 on libtpu 0.0.21.1; XLA tolerates it, Pallas/Mosaic modules do not deserialize | pin libtpu 0.0.23 for Pallas stages; compare only within a session |
| Colab VMs: no hugepage control, occasional mid-session loss [M] | absolute MFU is a lower bound; late shipping can lose results | ship reports before long lanes; a gcloud VM for
publishable absolutes |
4. What worked
4.1 Device-resident weights — text 104.8 → 7.4 ms
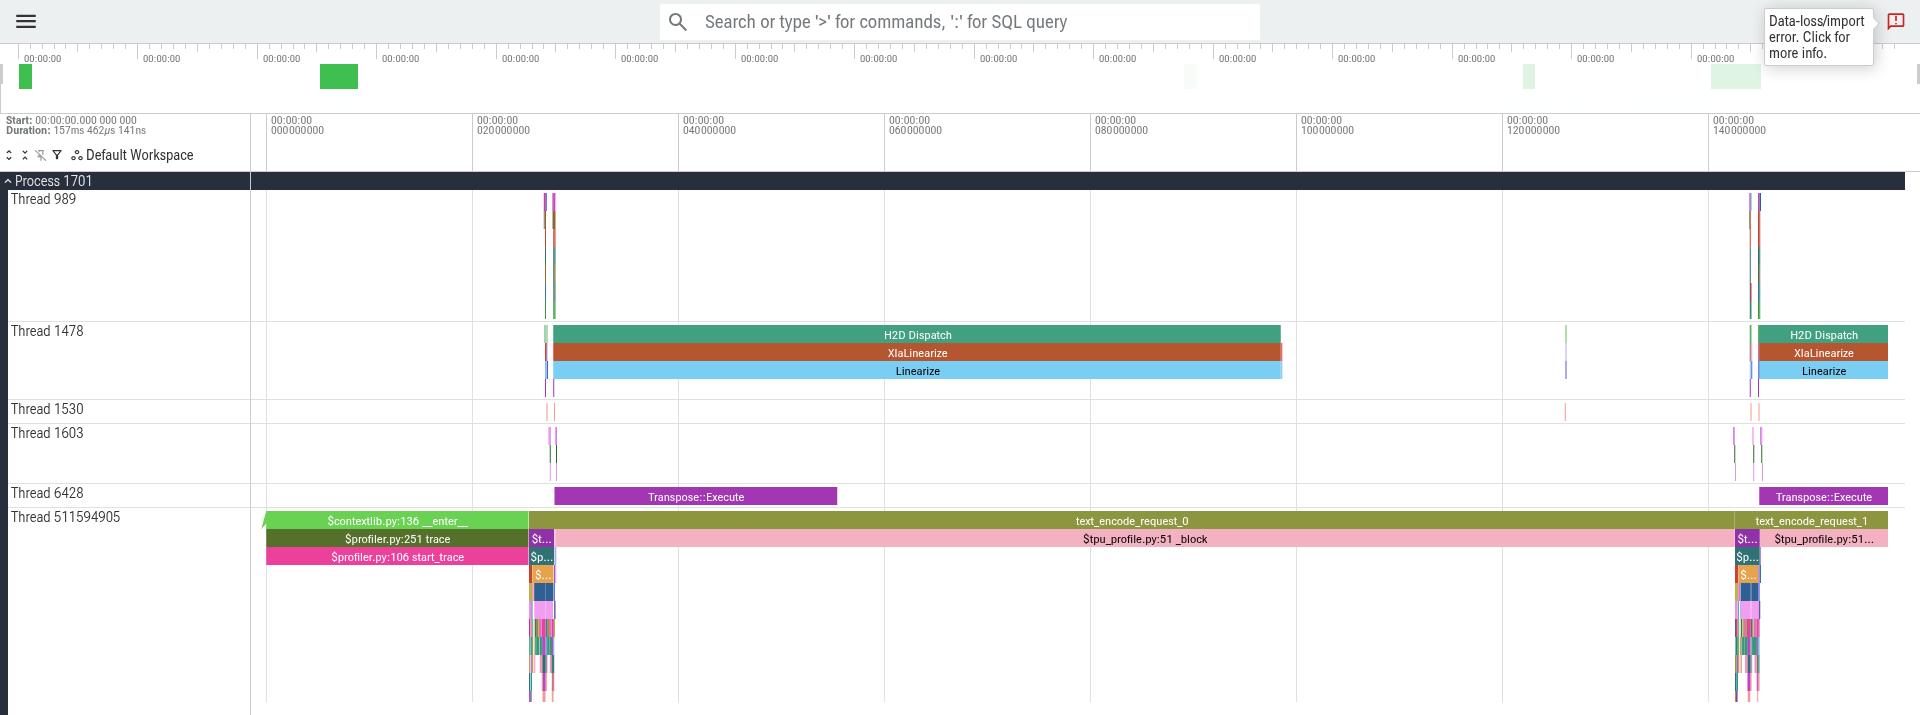
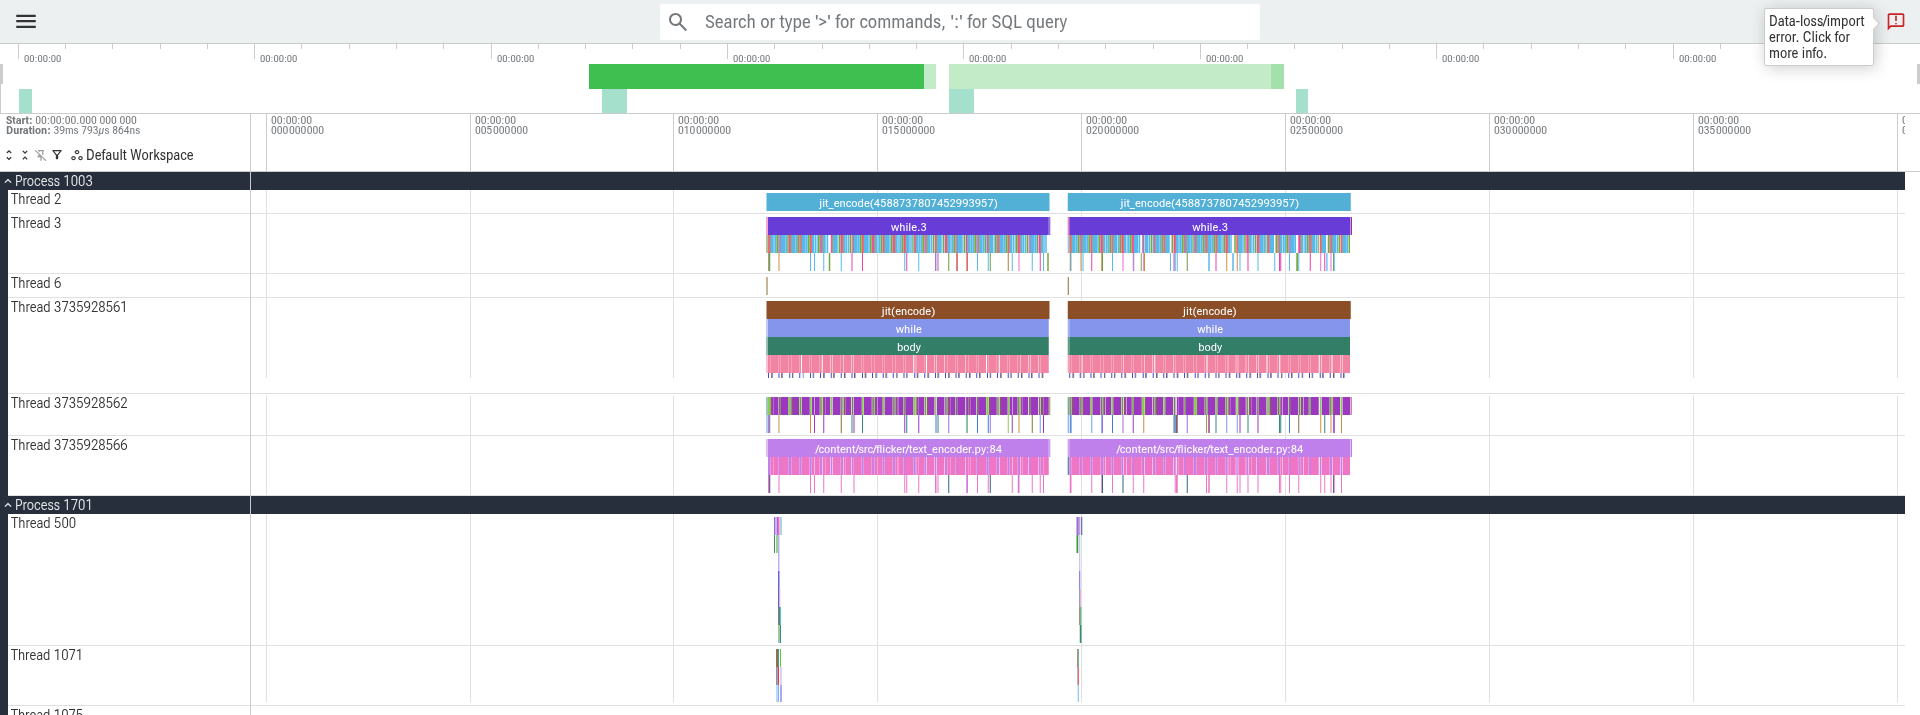
- Evidence. Text encoder occupancy 15
% [M];
bytes_in_use12.06 GiB against 13.18 GiB of weights [M] — 1.12 GiB missing. - Cause. Only
jnp.stack-ed layer blocks reached the device. The 742 MiB embedding table, the DiT's top-level weights (~0.39 GB) and the whole VAE were NumPy, so everyjitcall copied them host → device: 742 MiB at 8.4 GB/s = 88.2 ms per text encode [M]. Dispatch is asynchronous (host returns in 0.25 ms), so the copy blocked the device queue, not a host timer. A "weights are bf16" assertion passed NumPy too. - Fix.
jax.device_put(tree)in each loader; assertisinstance(leaf, jax.Array). Bit-identical. Also freed DiT −25 ms and VAE −5 ms (their own per-call copies); request occupancy 88 % → 99 %.
4.2 One 27-layer scan — text 16.9 → 7.2 ms
Three 9-layer scans over in-jit slices
of the stacked (27, …) weights made XLA copy ~1.8 GB per
call. One scan whose body emits each layer's output as ys
gives the taps as ys[8], ys[17],
ys[26] for 70 MB and no copies [M]. 7.2 ms is at the
compute bound for the measured GEMM rate. Bit-identical on CPU and L4,
not on TPU (max |Δ| 12-102): the two loop shapes
compile to different bf16 accumulation orders. Quality: equal distance
to the oracle for both (§6).
4.3 Pallas flash attention — DiT 780.6 → 387.7 ms
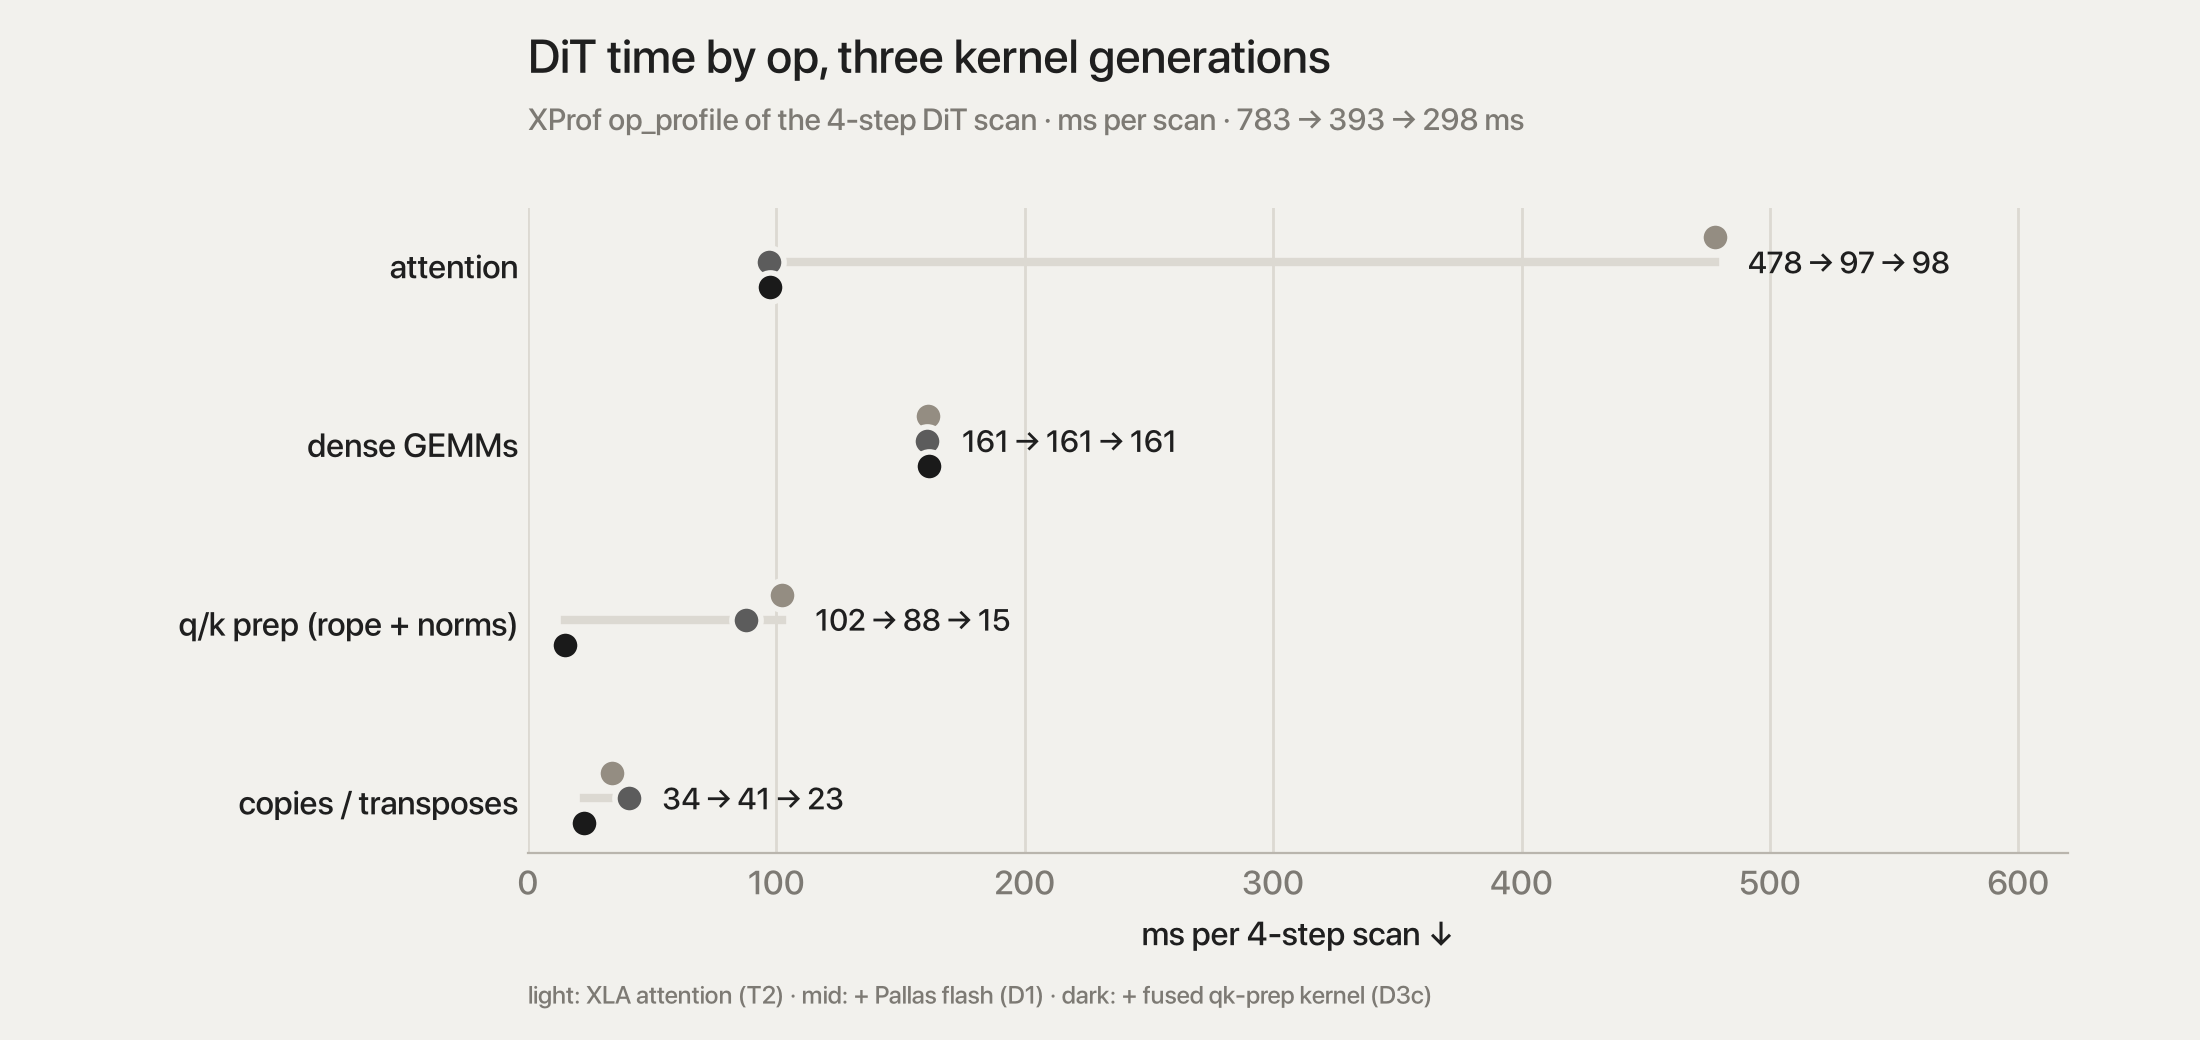
- Evidence. XProf op profile of the 783 ms DiT scan: attention 477.7 ms (61 %) — QKᵀ 134.2, softmax 157.8 at 1 TFLOP/s streaming 1.29 TB/s, P·V 185.7 [M].
- Cause. Naive SDPA writes the
24 × 4608 × 4608score matrix to HBM in fp32 — 2.04 GB per call, reads and rewrites it through softmax, reads it again for P·V: ~8 GB of traffic for 0.26 TFLOP of math, 100 calls per image. Intensity ≈ 30 FLOP/B, far under the ridge. - Fix. Flash attention tiles Q, streams K/V through
on-chip memory with an online softmax (running row max and sum,
rescaling by
exp(m_old − m_new)— exact up to rounding order), and writes only the(24, 4608, 128)output: ~170 MB per call, ~50× less. Per call 5.47 → 1.16 ms (4.7×) at 55.4 dB vs an fp32 reference (naive: 55.1) [M]. Amdahl on 61 % predicts ~403 ms; measured 387.7. - Tiles. The kernel needs tiles that divide L = 4608 = 2⁹·9, so 1024/2048 are illegal and 1152/1536/2304 legal. 128×128 tiles were 3× slower than naive — each tile must carry enough MXU work to hide the next tile's DMA. Tiles are derived per resolution; a length with no legal tile falls back to SDPA.
- Flash vs splash. Tied on speed (1.161 vs 1.180 ms). Splash skips masked tiles; DiT attention is full, so it has nothing to skip. Flash won on numerics (applies 1/√d in fp32; splash needs a bf16 pre-scaled q, 54.6 dB) and a simpler API. Splash is the right tool for causal/padded/local masks.
- Toolchain. Colab ships jax 0.7.2 with
libtpu 0.0.21.1;
jax[tpu]==0.7.2declares 0.0.23. XLA runs on the older runtime; Pallas does not ("Failed to deserialize the Mosaic module"). Pallas stages pin libtpu 0.0.23 before jax is imported.
4.4 Fused qk-prep kernel — DiT 387.6 → 298.6 ms
- Evidence. After flash, the chain from the q/k/v
projection to the attention kernel — head reshape/transpose, QK-RMSNorm,
rope,
[txt|img]concat — cost ~114-128 ms of HBM round trips against a ~10-20 ms byte floor [M/D]. - Three XLA rewrites failed. Lane-friendly rope
tables with a
roll-based pair swap (+1.5 %), reshape-and-flip swap (+0.8 %: fastest in isolation, slower in the fused graph), splittinglinear1at load (−0.6 %). Each moved the cost between profile buckets; XLA will not fuse a lane reduction, a pair swap and a head transpose into one pass. - Fix. One Pallas pass per stream: grid (row
tile, head); input
BlockSpecs pick head h's 128-wide q/k/v columns straight from the(B, L, 3·H·D)projection output; the output index map(b, h, i, 0)drops each tile into its(B, H, L, D)slot — the DMA does the transpose. The body touches only 2-D(rows, 128)tiles: lane-mean RMSNorm,pltpu.rollpair swap + parity select, the same cast points. Prep ~114 → **~12 ms**; one ulp from the XLA chain; gate PASS (§6). - Two bugs caught before they shipped. Index maps
returned element offsets (
i·rows) instead of block indices (i) — correct by clamping at 1-2 grid steps, corrupt at the production 9; and the first body used strided lane slices, 4-D reshapes and 3-D transposes, which Mosaic rejects ("Only 2D gather is supported"). CPU interpret mode proves numerics, not compilability.
5. What did not work (measured, closed)
| attempt | result [M] | why |
|---|---|---|
per-call jax.jit hoisting |
0.096 ms | JAX already caches traces |
| scan unroll 2/4/5 | 7-10 % slower, +14-20 s compile | — |
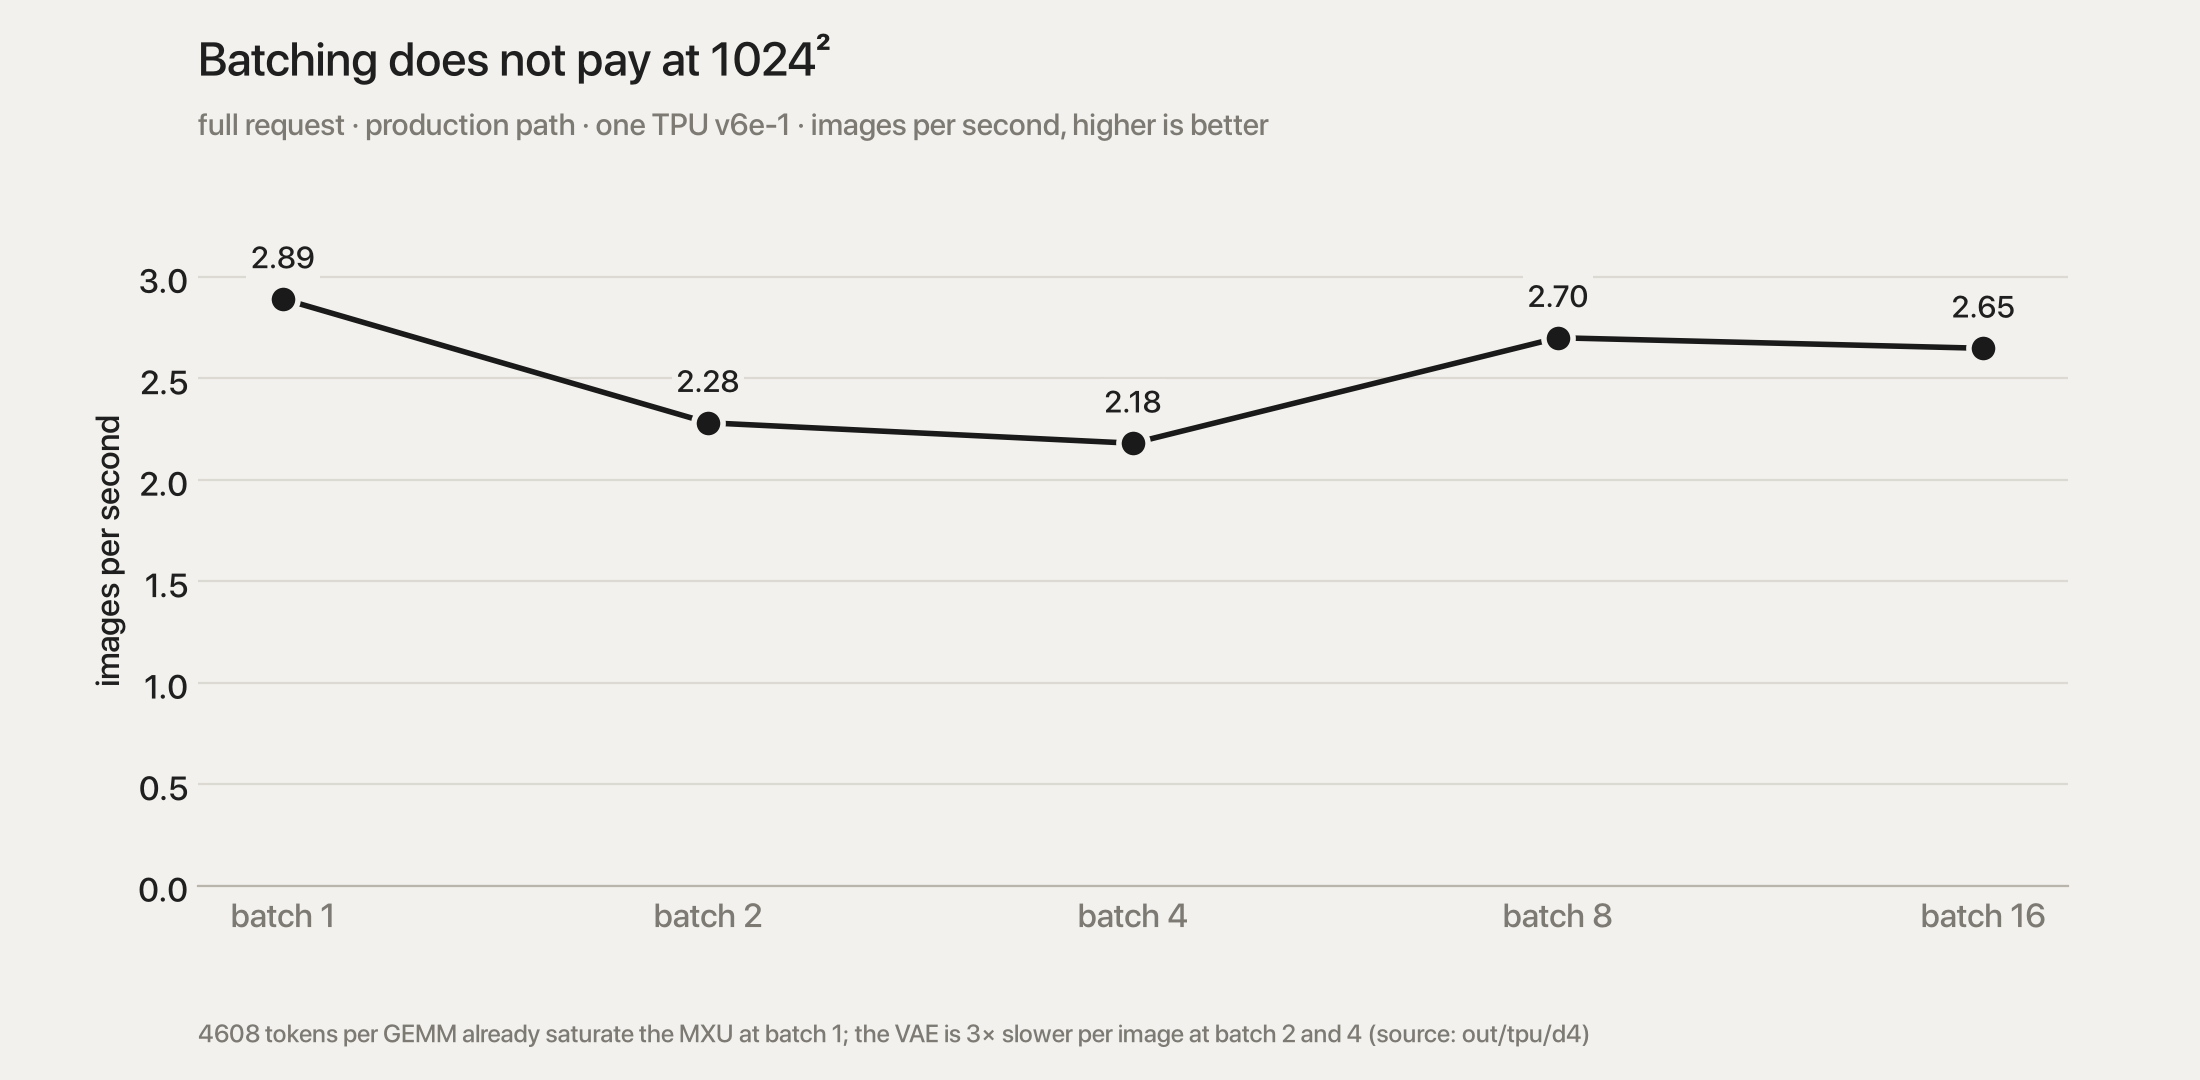
| batching B = 2/4/8/16 | 2.28 / 2.18 / 2.70 / 2.65 img/s vs 2.89 at B=1 | 4608 tokens per GEMM already saturate the MXU; DiT per image rises with B (298 → 336 ms); VAE is 3× worse per image at B=2/4 |
| step-invariant prologue hoist | ~0 | txt_in(ctx) + rope tables ≈ 0.04 ms once weights are
resident |
| VAE sub-pixel upsample (fold nearest-2× + 3×3 conv into one low-res conv) | 37.2 → 48.9 ms | exact (131 dB fp32) and gate-passing, but XLA runs the 4·C_out conv worse |
one fused jit for the whole request |
−2.7 ms | not byte-identical (max 5 uint8): one graph changes fusion at stage boundaries |
| int8 W8A8 (per-token act, per-channel weight) | DiT 297.7 → 245.5 ms | gate FAIL: LPIPS 0.0327, step SNR 25.3 dB |
| SmoothQuant int8, two largest GEMMs, α 0.5 / 0.35 | DiT ~251 ms, request ~299 ms | gate FAIL at a plateau: LPIPS 0.012, DINO p5 0.974-0.979, step SNR 32.3-32.5 dB |
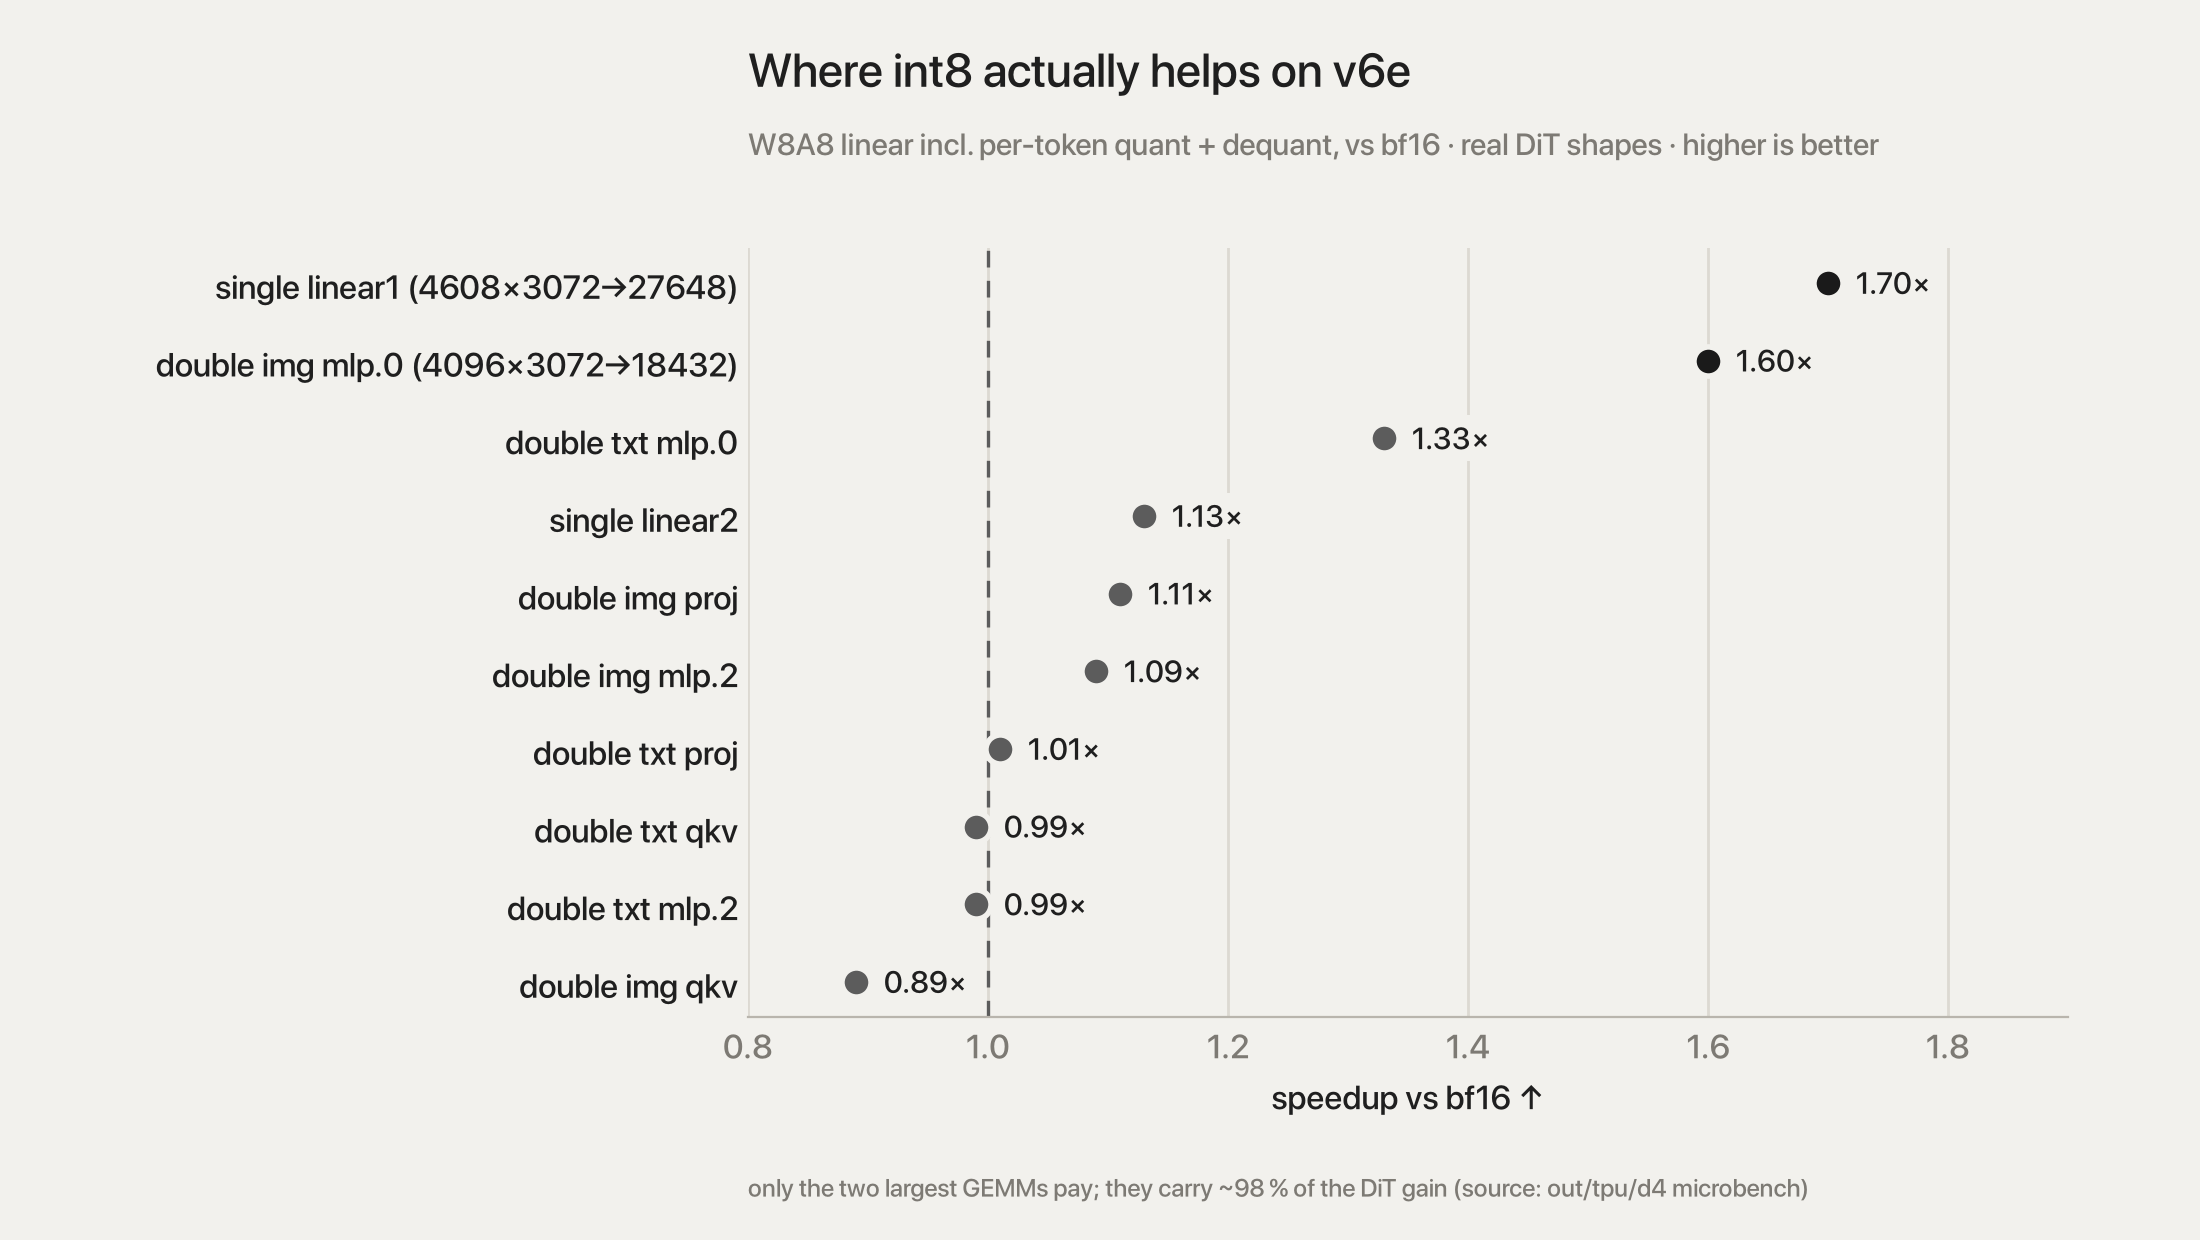
int8 detail. v6e runs int8 at up to 2× bf16, but
only on large shapes: the single-block linear1 1.70× and
the double image mlp.0 1.60× with quant + dequant included;
the rest 0.89-1.13× [M]. Those two GEMMs carry ~98 % of the gain and
nearly all the error (quantizing linear1 alone: 30.4 dB
latent SNR vs 30.7 for both). Per-token W8A8 plus SmoothQuant saturates
at LPIPS ≈ 0.012 — 1.9× the implementation floor, yet ~3.4× closer to
the oracle than the native text encoder. Passing needs a different
scheme (per-group scales, a low-rank bf16 branch as in SVDQuant, or
quantization-aware tuning). Shipped as an opt-in lossy
tier on main:
Klein4B(gemm="smooth_large") plus a calibration file from
flicker.calibrate.absmax (8 held-out prompts, α 0.35) —
request ~299 ms, 3.34 img/s, LPIPS 0.012. bf16 stays the default.
6. Quality gating
Floors were calibrated on the isolated DiT/VAE lane (oracle ctx, JAX on L4 vs PyTorch on L4, 32 prompts × 3 seeds = 96 pairs): LPIPS median ≤ 0.00638, DINO p5 ≥ 0.98345, step-latent SNR ≥ 33.19 dB [M]. Never retuned.
| lane (96 pairs vs oracle) | LPIPS median | DINO p5 | step SNR | verdict |
|---|---|---|---|---|
| frozen v6e-1 lane | 0.00548 | 0.98571 | 33.92 | pass |
| D1 flash | 0.00528 | 0.98568 | 33.75 | pass |
| D3c qk-prep (production) | 0.00497 | 0.98435 | 35.65 | pass |
| SmoothQuant α 0.35 | 0.01197 | 0.97930 | 32.34 | fail |
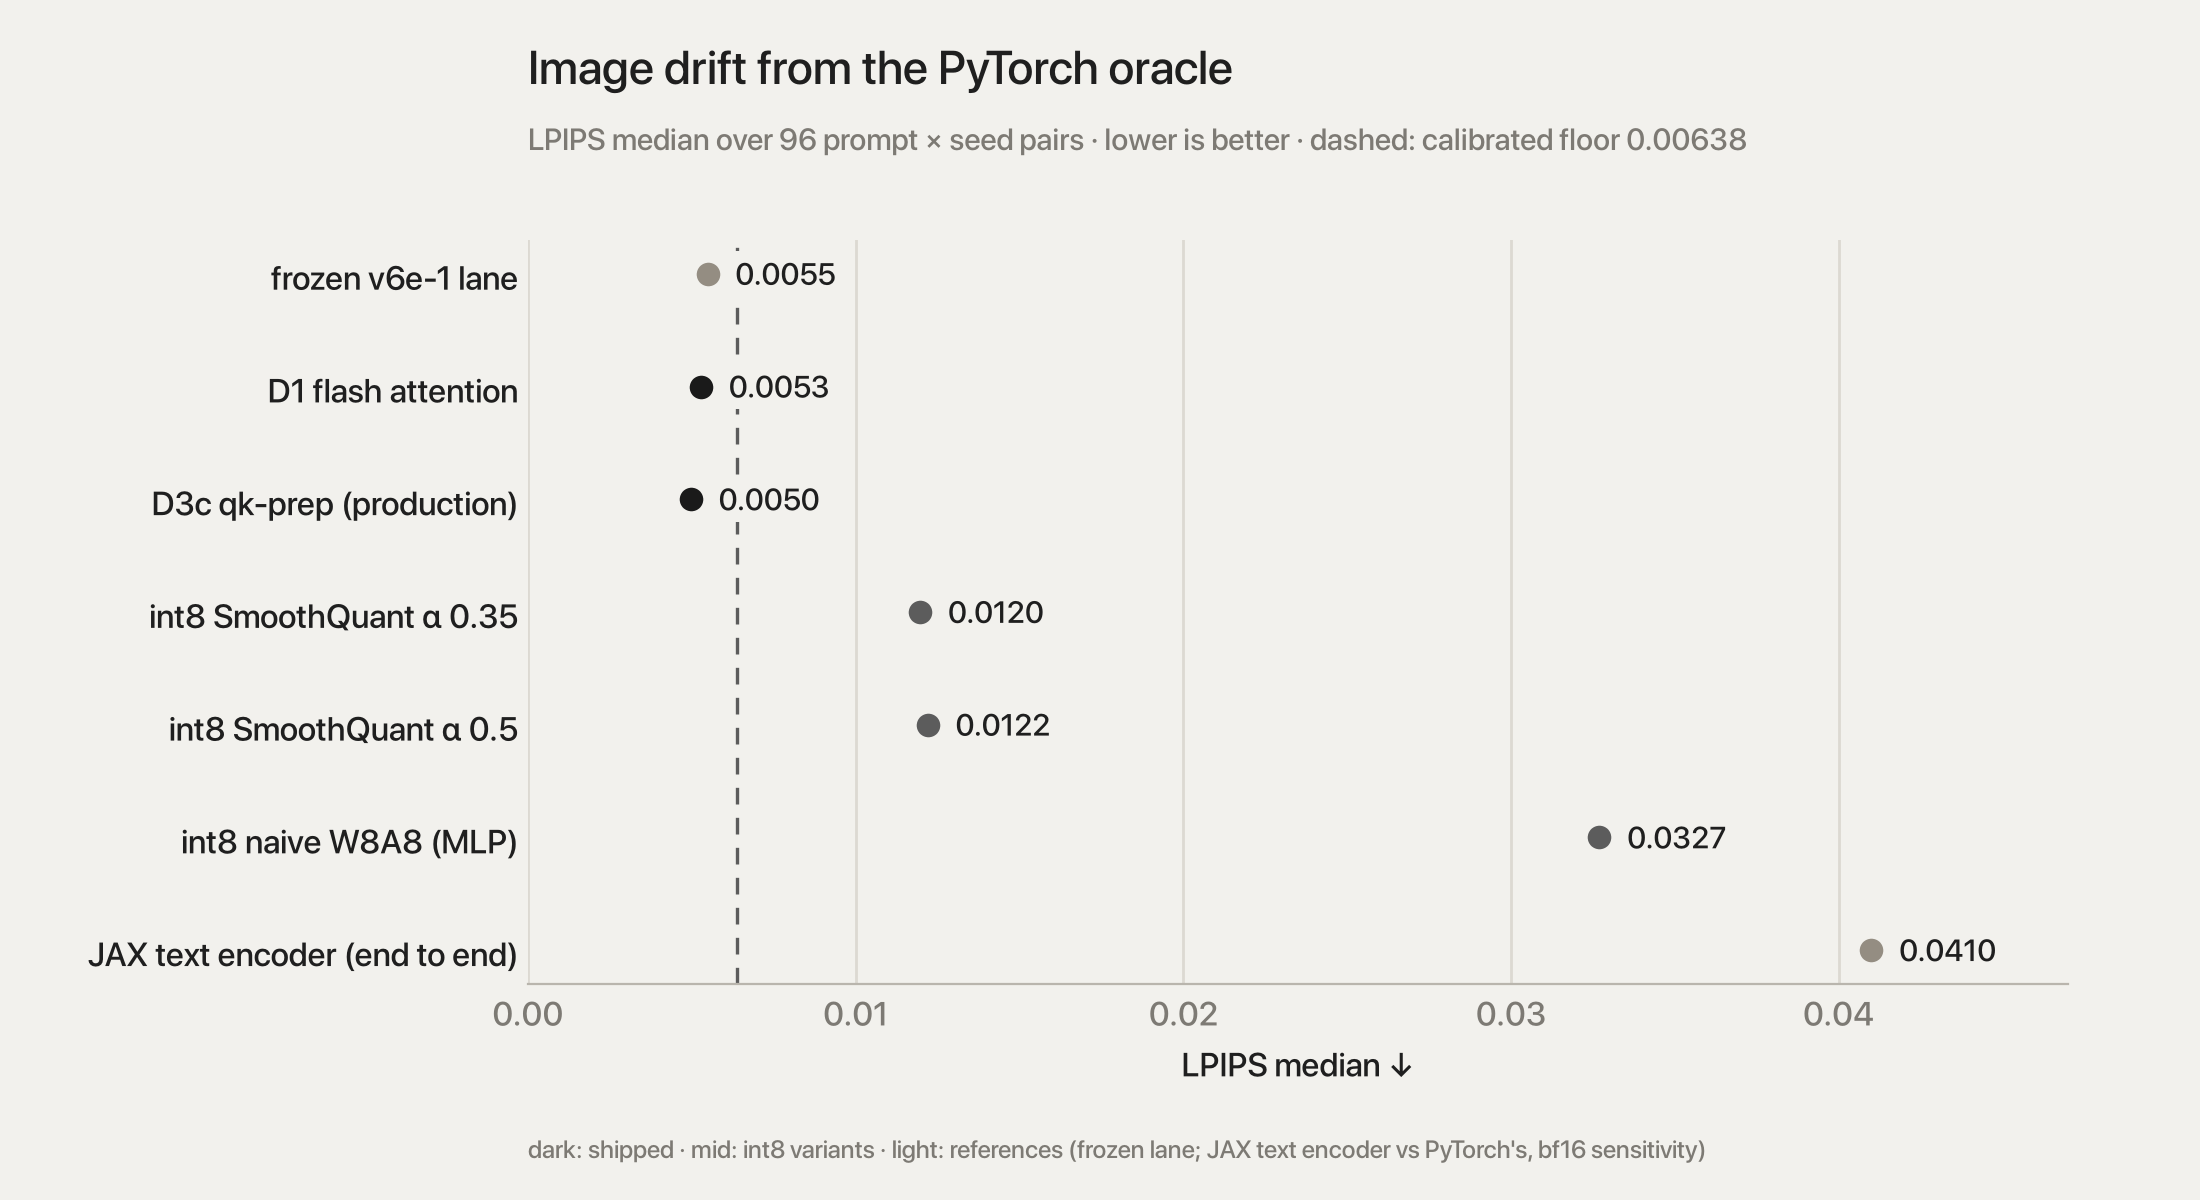
Three gating lessons: (1) compare to the oracle, never to the previous implementation — a gate that measured the one-scan encoder against the three-scan one failed a pure loop restructure; against the oracle the two are equidistant (ΔLPIPS +0.00003, 16 closer / 16 further). (2) Pre-register the rule; prefer paired statistics to per-lane tails (a p5 over 32 prompts is one or two images). (3) Use the sample the floors were calibrated on: the unchanged production lane scores LPIPS 0.00653 on seed 0 alone — above the floor — and 0.00548 on all 96 pairs.
The text encoder's own gap to PyTorch (LPIPS 0.041 end to end) is bf16 sensitivity, not a porting bug: a loop-shape change alone moves padded-token conditioning to 22.5 dB and images to LPIPS 0.023.
7. Where the time goes now
| bucket (DiT, 297.6 ms/scan) | ms | share | rate [M] |
|---|---|---|---|
| dense GEMMs | 161.3 | 54 % | 701 TFLOP/s — at the measured bf16 peak |
| flash attention | 97.6 | 33 % | 270 TFLOP/s (exp/rescale on the vector unit) |
copies (single-block linear1 output split) |
22.7 | 8 % | — |
| qk-prep kernel | 12.3 | 4 % | memory-bound |
| norms/modulate, rope | 2.6 | 1 % | — |
Full request 344.9 ms of device time per image, 4.3 ms idle. What is left is compute: bf16 GEMMs at peak (only lower precision moves them) and attention's vector-unit work.
8. Method, transferable
- Occupancy first, then per-op roofline (XProf op_profile, not name heuristics — a heuristic rollup gave GEMMs an impossible 66 ms).
- Calibrate the denominator. One 4096² GEMM reads 400 TFLOP/s (launch-ramp limited); 20 chained 8192² GEMMs read 683. Every "%MFU" before that was 1.7× pessimistic.
- Same-session A/B, versions recorded. A vendored
copy of the committed code (
flicker_base) loaded beside the new code gives an exact old-vs-new in one session, one weight load. - Prove the B arm ran. A 0.9996× "speedup" with
identical HLO was
jitreusing a trace cached before a monkeypatch. Kernel choices are now static config fields — part of the cache key. - Microbenchmarks mislead on fusible ops; judge at the DiT level.
- Pallas on TPU: put layout in
BlockSpecindex maps (block indices, not offsets); keep the body 2-D on(rows, 128)tiles; interpret mode checks numerics, the chip checks compilability. - Dry-run every non-accelerator path on CPU with tiny weights — it caught five plumbing bugs (stacked-dict indexing, AOT static arguments, the patch guard, index maps, a scorer overwrite).
- Ship results before the long tail. The Colab VM died late in two sessions; results are now shipped before the quality lanes.
Appendix A: optimization mental model (teaching notes)
Written at the flash-attention stage (435.7 ms, 2026-09-26); the later stages are in Appendix B. Every number is measured.
FLUX.2 [klein] 4B, 1024², batch 1, 4 steps, bf16, one TPU v6e-1.
Every number is measured; sources in results.md,
metrics-progress.md, out/tpu/*.
0. Where we are
| stage | request p50 | text | DiT | VAE | vs baseline |
|---|---|---|---|---|---|
| frozen baseline | 944.67 ms | 104.81 | 808.92 | 42.98 | — |
| T1 residency + scan27 | 832.21 ms | 7.41 | 784.04 | 37.54 | 1.135× |
| D1 flash attention | 435.7 ms | 7.4 | 387.7 | 37.5 | 2.17× |
Quality held at every kept step: the D1 image gate (96 pairs vs the PyTorch oracle) lands at or better than the frozen TPU lane. sglang-diffusion on an RTX PRO 6000 Blackwell is 675.6 ms.
1. The mental model: where latency hides
wall time = device-busy time  +  device-idle time
            ├─ compute-bound ops   (limited by FLOP/s)
            └─ memory-bound ops    (limited by bytes/s)
                                    └─ host work, H2D/D2H transfers, dispatch, waits
Three questions, in order, decide every optimization:
- Is the device idle? occupancy = device-busy ÷ wall. Text encoder was 15 % → the problem was not the math. DiT was 97 % → the problem was the math (or its memory traffic).
- For busy time: compute- or memory-bound? Compare each op's achieved FLOP/s and bytes/s to the chip's two ceilings. v6e-1: ~683 TFLOP/s (measured, chained bf16 GEMM) and ~1.64 TB/s HBM. The ridge is 683/1.64 ≈ 420 FLOP per byte. Below it an op waits on memory; above it, on the MXU.
- Does the fix change numerics? If yes, it is gated against the oracle; if not, prove bit-identity.
The two cheap sanity tools that caught most mistakes:
- Roofline arithmetic — FLOPs ÷ time must not exceed the chip. It killed a bogus sglang number (184 ms ⇒ 758 TFLOP/s) and a profiler rollup that gave GEMMs an impossible 66 ms.
- Memory accounting — resident bytes should equal weight bytes. 12.06 GiB measured vs 13.18 GiB of weights exposed the biggest hidden cost in the project.
2. What worked, and why
2.1 Device-resident weights (text 104.8 → 7.4 ms; DiT −25 ms; VAE −5 ms)
- Mechanism. A
jax.jitargument that is a NumPy array is copied host→device on every call. Our loaders returned NumPy for everything except thejnp.stack-ed layer blocks: the 742 MiB text embedding, the DiT's top-level weights (~0.39 GB), the whole VAE. - Why it hid. Dispatch is asynchronous: the host returns in 0.25 ms and the copy blocks the device queue, not the host. It looked like "slow encoder", not "transfer". 742 MiB at ~8.4 GB/s is 88 ms — the missing time exactly. A dtype-only assertion ("all weights are bf16") passed NumPy too.
- Fix.
jax.device_put(tree)at the end of each loader; assertisinstance(leaf, jax.Array). Bit-identical. The trace confirms it: text occupancy 15 % → 93 %, whole request 88 % → 99 %.
2.2 One 27-layer scan instead of three sliced ones (text 16.9 → 7.2 ms)
- Mechanism. The three taps (layers 9/18/27) were
produced by slicing the stacked
(27, …)weights into three(9, …)chunks inside jit and scanning each. XLA materialises a slice that feeds a loop — ~1.8 GB of copying per call — plus extra trace/lower work. One scan whose body emits each layer's output asysgives the taps asys[8], ys[17], ys[26]for 70 MB, no copies. - Result. 7.2 ms is at the compute bound for the calibrated rate — the encoder is done.
- Numerics lesson. Identical on CPU/L4, not on TPU (max |Δ| up to 102): XLA compiles the two loop shapes with different bf16 accumulation orders. A pure loop restructure moved padded-token conditioning to 22.5 dB and images to LPIPS 0.023 — half the entire PyTorch-vs-JAX gap. So the "text-encoder regression" is mostly bf16 sensitivity of padded positions, not a porting bug.
2.3 Fused (flash) attention in the DiT (DiT 780.6 → 387.7 ms; request 1.90×)
- Diagnosis. XProf op profile: attention = 478 ms of 783 ms (QKᵀ 134, softmax 158, PV 186). Softmax ran at 1 TFLOP/s while streaming 1.29 TB/s — pure memory traffic.
- Mechanism. Naive attention writes the
24 × 4608 × 4608score matrix to HBM in fp32 — 2.04 GB per call, then reads/writes it through softmax and reads it again for P·V: ~8 GB of traffic for 0.26 TFLOP of math, 100 calls per image. Intensity ≈ 30 FLOP/B, far below the 420 ridge. - Flash. Tile Q; stream K/V tiles through on-chip
memory; keep a running row max
mand sumℓ, rescaling the accumulator byexp(m_old − m_new)when the max grows ("online softmax" — exact up to rounding order). Only(24, 4608, 128)goes back to HBM. Traffic per call ≈ 170 MB (~50× less); the kernel becomes compute-bound: 1.16 ms/call ≈ 225 TFLOP/s (exp/rescale run on the slower vector unit, so it stays below GEMM peak). - Why tile size dominates. The kernel requires tiles that divide L = 4608 = 2⁹·9, so 1024/2048 are illegal; 1152/1536/2304 are legal. 128×128 tiles were 3× slower than naive — each tile must carry enough MXU work to hide the DMA of the next one. Winner: q 2304, k 1536.
- Amdahl. 4.7× on 61 % of the DiT predicts ~403 ms; measured 387.7 (freed memory bandwidth helped the rest).
- Flash vs splash. Tied on speed. Splash's advantage is skipping masked tiles; DiT attention is full, so nothing to skip. Flash won on numerics (it applies 1/√d in fp32; splash needs a bf16 pre-scaled q) and a simpler API.
- The old fp32 upcast bought nothing: on TPU at default precision an fp32 matmul is a bf16 MXU pass anyway — so removing it cost no accuracy (55.4 dB vs 55.1 dB against an fp32 reference).
3. What did not matter (measure before fixing)
- Per-call
jax.jitconstruction: 0.096 ms. JAX caches traces by function; hoisting was tidy, not fast. - Scan unroll (2/4/5): 7-10 % slower, 14-20
s more compile. Keep
unroll=1. - Batch 4 at 1024² was slower per image than batch 1 (the 2 GB-per-image score buffers). Worth re-measuring now that flash removed them.
4. Method lessons (the transferable part)
- Occupancy first, then per-op roofline. Idle device → host/transfer problem. Busy device → compare achieved FLOP/s and B/s to the ceilings; a far-below-peak op with high B/s is memory-bound.
- Calibrate the denominator. A single 4096² GEMM read 400 TFLOP/s (launch-ramp limited); 20 chained 8192² GEMMs in one jit read 683. Every "%MFU" before that was understated by 1.7×.
- Same-session A/B only. Different sessions/toolchains move numbers (libtpu 0.0.21 → 0.0.23 changes the compiler). Always time the old path next to the new one.
- Prove the B arm ran. D0's first full-DiT A/B was
0.9996× with identical HLO:
jitreused a trace cached before a monkeypatch. Guard: the two outputs must differ; better, make the choice a static config field so it is part of the cache key. - Toolchains are pairs. jax 0.7.2 declares libtpu 0.0.23; Colab shipped 0.0.21. XLA tolerated it; Pallas (serialised Mosaic modules) did not. Custom kernels break first.
- Gates must measure distance to the truth. Comparing a change to the previous implementation (G1) fails any reordering. Compare to the oracle, pre-register the rule, prefer paired statistics over per-lane tails (a p5 over 32 samples is one or two images), and use the sample size the floors were calibrated on (96 pairs, not seed 0 alone).
- Dry-run everything that is not the accelerator. Tiny-weight CPU runs of each bench caught three plumbing bugs (stacked-dict indexing, AOT static args, the patch guard) before paying for a TPU.
5. Transfer checklist (e.g. hummingbird / Stable Audio 3)
6. What is left in the DiT (from the op profile, pre-flash)
Dense GEMMs ~161 ms (already ~700 TFLOP/s — lever is int8, D4),
rope ~87 ms (fp32 on an
f32[1,24,4608,64,1,2] layout — memory-bound, D3),
copies/concats ~34 ms, norms/modulate ~15 ms, attention now ~116 ms.
Step-invariant work (D2) is small but free.
Appendix B: optimization log
The rolling log kept during the work, one entry per plan or session, unedited. Paths refer to the flicker repository.
2026-09-26 — text encoder, phase T1 started
- confirmed (user A/B,
docs/encoder_ab_test.md): 741.9 MiBembed_tokenshost-resident, re-sent H2D every call (88.2 ms @ 8.4 GB/s). DiT top-level (~0.39 GB) and whole VAE also host-resident. - text p50 with params on device: chunk3 16.89 ms, scan27 7.18 ms. roofline 3.2 ms (datasheet) / ~7.3 ms (calibrated 400 TF/s) → scan27 is at the calibrated-compute bound.
- scan27 not bit-identical on TPU (max|d| 54.0; exact on L4) → gated on G1 (ctx SNR by token0/real/pad, then rev3 32 images vs frozen under calibrated floors).
- clue for the pad-quality question: compile-order drift (54) ≈ official-vs-native drift (64-88).
- T1 delegated: loader residency, scan27 trunk, hoisted jits, numpy tokens.
2026-09-26 — T1 landed (uncommitted), reviewed
- src: loaders
device_put(text/dit/vae);trunk= one 27-layer scan, tapsys[k-1]; module-level jits inpipeline.py;tokenizereturns numpy. tools: campaign leaf check requiresjax.Array;text_variants.pykeeps its ownTAPS_PER_CHUNK. tests:tests/test_residency.py(+2). - suite 150 passed / 1 skipped. scan27 vs chunk3 bit-identical on CPU (tiny weights) — TPU is known not to be (max|d| 54), so G1 still gates it.
- next: T2 v6e-1 session (text/request p50, per-call jit cost, G1, 1024² traces + HLO). needs HF token rotation first.
2026-09-26
— T2 landed: one v6e-1 session, residency + scan27 priced,
G1 fails
Code d1f5e17, bundle 4f89a325…, jax 0.7.2,
TPU v6 lite. Full write-up: results.md; evidence
out/tpu/t2/; archive
t2-v6e1-4f89a325a2a754f8.tar.gz on
tensorkelechi/flicker-tpu.
- Resident load 34.7 s,
bytes_in_use13.198 GiB (was 12.06); every text/dit/vae leaf is ajax.Array(text 12 leaves / 5.80 GiB — the 741.9 MiBembed_tokensis now on device), zero host leaves. The +1.14 GiB is the predicted 0.78 embed + 0.39 DiT top-level. - Request 944.67 → 832.21 ms (1.135×), 1.2016 img/s. Text 104.81 → 7.41 ms (14.14×), DiT 808.92 → 784.04, VAE 42.98 → 37.54. Text device-busy 14.97 % → 93.09 %; DiT 99.89 %, VAE 97.61 %, request 99.37 % (baseline 96.79 / 85.11 / 88.41).
- Per-call
jax.jitconstruction costs 0.096 ms, host-side only (7.359 vs 7.263 ms); the lowering cache absorbs it. The open question indocs/encoder_ab_test.mdis closed: the frozen 104.81 ms was not hiding ~90 ms of jit construction. - The frozen GEMM denominator was ramp-limited: 20 chained 8192³ matmuls run at 683.1 TF/s vs the 4096² single shot's 396–400 TF/s (re-measured at 396.08). DiT is 19.40 % datasheet / 26.07 % calibrated; VAE 24.34 / 32.71; request 19.75 / 26.55.
- G1 fails. ctx sweep: token 0 98.64 dB,
real-before-pad 39.39 dB, padding 22.52 dB (h9 38.96 vs
h18 21.75 / h27 22.67),
max|d|12.0–102.5, 0/32 identical. Images (32 pairs, Modal L4, pinnedquality_metrics): LPIPS median 0.023258 vs floor 0.006379 (3.65×), DINO p5 0.935924 vs floor 0.983453. Both fail. It is still better than the official-vs-native text swap (0.041045 / 0.950005, also fail), soscan27is less wrong than the port's existing text divergence — but the bar is the DiT/VAE-only drift, and 3.65× it is not accepted. Keepchunk3as production. - Tooling:
tools/bench_t2.py,tools/t2_snr.py,tools/t2_trace.py,tools/modal_t2_metrics.py;t2stage intpu_correctness.py(+fresh()module reload);tpu_job.pynow takes the HF token from an uploaded/content/.flicker_hf_token(existence+size logged, value never in source/argv/ logs, unlinked infinally). - Traps worth remembering:
tpu_campaign.prepare_inputsasserts the inputs archive's manifest suite sha equalstests/prompts.json, and the pinned archive is rev1-keyed while the suite is rev3 — T2 verifies the archive digest and the noise digest instead and records the mismatch; a warm Colab kernel reuses the previous run's stage module unless it is reloaded; Modal cannot deserialize a returnedDinoScorer.meta()(SizeDict), so that result ships from inside the function.
2026-09-26 — T2 review (planner)
- verified against
out/tpu/t2/t2_out/report.json+metrics-lpips-dino.json: request 944.67 → 832.21 ms (1.135×), text 104.81 → 7.41 ms, DiT 808.92 → 784.04, VAE 42.98 → 37.54; per-call jit = 0.096 ms; chained GEMM 683 TF/s (old 400 was ramp-limited). token leak scan of tools/docs/out/results: clean. - G1 FAIL is a gate-design error (mine): chunk3 is not a reference. Replaced by G1′ = oracle-relative paired comparison on rev1 prompts. scan27 stays in production, provisional.
- evidence for track Q: loop-shape-only change → pad ctx 22.5 dB, LPIPS 0.023 ≈ half of torch-vs-JAX.
2026-09-26 — G1′ launched; DiT plan drafted
- G1′ (oracle-relative scan27 vs chunk3, rev1 prompts, seed 0, 3 lanes) running on a worker.
- DiT draft:
docs/dit-plan.md. key evidence: HLO holdsf32[24,4608,4608]scores (2.04 GB/block, 100 calls/image ≈ 800 GB traffic ≈ 490 ms); T2 rollup charges attention ~637 ms but its GEMM figure (66 ms) is impossible (≥167 ms needed) → heuristic, D0 must measure with op_profile. - env skew: local jax 0.11.2 vs TPU 0.7.2 (Pallas APIs differ).
2026-09-26 — G1′ result
- ran (user-launched
!session, token never in agent tools). scorer fixed to fetch lane PNGs from the shipped archive on Modal (local mount upload died at ~150 kB/s). - pre-registered FAIL on DINO p5 only (Δ −0.00599 vs −0.005); paired ΔLPIPS +0.00003 (CI ±0.005), 16/16, pad SNR Δ −0.04 dB. equivalence in every paired stat; p5-over-32 is the noisiest possible gate.
- proposed replication rule (fixed now, before data): seeds 1+2 (64 pairs, oracle + noise exist), paired bootstrap: median ΔLPIPS CI95 upper ≤ 0.00638 AND median ΔDINO CI95 lower ≥ −0.005 AND pad SNR Δ ≥ −1 dB.
- decision (user): keep scan27 as an explicit override of the G1′
FAIL; replication deferred. text encoder phase closed. next: DiT plan
(
docs/dit-plan.md), starting D0.
2026-09-26 — D0 part A: exact op profile of the T2 DiT trace (local, no TPU)
tools/d0_op_profile.py reads the shipped
dit_scan xplane with XProf's
op_profile tool data: per-HLO-op self
time, FLOPs and bytes accessed (rawTime is picoseconds and
inclusive of children, so
self = node - sum(children); that partition sums back to
the root exactly for all three metrics). Normaliser: the trace holds
iterations = 3 DiT scans, read from
out/tpu/t2/t2_out/report.json, never guessed. Artifact
out/tpu/d0/op-profile.json.
| bucket | ms/scan | % dev | TFLOP/s | GB/s |
|---|---|---|---|---|
attention.pv_dot (bhls,bhsd->bhld) |
185.705 | 23.66 | 71 | 1125 |
| dense_gemm (projections/MLPs) | 161.176 | 20.53 | 702 | 431 |
| attention.softmax (exp/reduce-sum/div over 24x4608x4608) | 157.752 | 20.09 | 1 | 1292 |
attention.qk_dot (bhld,bhsd->bhls, fused
reduce-max) |
134.216 | 17.10 | 98 | 1540 |
| rope | 87.118 | 11.10 | 0.25 | 1279 |
| copies/transposes/concats | 33.854 | 4.31 | 0.55 | 1647 |
| norms/modulate | 15.103 | 1.92 | 1.41 | 1025 |
| other | 8.221 | 1.05 | 0.01 | 5276 |
Device 785.0 ms/scan, idle 1.9 → device-busy 783.1 ms/scan, against 783.2 ms measured independently by the trace-union occupancy in T2 (-0.00 %). 139.7 TFLOP/scan at 177.9 TFLOP/s (reproduces the roofline 1.3962e14 and T2's 178.08 TFLOP/s), 915 GB/scan at 1166 GB/s.
- Attention is 477.7 ms/scan = 60.9 % of the DiT. The
plan's ~490-580 ms estimate holds and the heuristic
trace-breakdown.jsonrollup (QK^T 80 + PV 557 ms, "82 %") is replaced by a measurement. - Top ops per scan: PV
fusion.332148.0, softmax reduce-sumfusion.331128.4, QK^Tmultiply_reduce_fusion.33107.7 (the three stream the 2.04 GBf32[24,4608,4608]scores buffer at 1.1-1.5 TB/s, which is the whole diagnosis). Longest dense GEMM: single-blocklinear1(fusion.323, 4608x3072x27648) 86.2 ms at 726 TFLOP/s. - The reduce-max is fused into the QK^T convolution,
so
attention.qk_dotcarries one read of the scores rather than a separate pass. dense_gemmat 702 TFLOP/s reads above the 683 TF/s chained-GEMM calibration because fused elementwise rides the same kernel; it is not a new peak.- D3 is priced, not speculative: rope costs 87.1
ms/scan (11.1 %) in the fp32
(1,24,4608,64,1,2)layout — more than copies + norms + other combined. - Buckets are a mapping, not a measurement: a norm fused into a GEMM is charged to the GEMM, because that is what the kernel is. Totals therefore sum to the device time by construction, and the top-30 table in the report is the audit trail for any bucket's value.
- review (planner): widened the D0 tile sweep to every 128-multiple dividing 4608 (128/256/512/1152/ 1536/2304 + split inner blocks) → 39 valid tilings per kernel; worker had kept only 128/512. plan-tests rewritten as invariants. suite 158 passed / 1 skipped.
- D0 session 1 (14:41Z): crashed after load —
block_params(p, ...)[0]indexed a scan-stacked dict (KeyError 0) in bench_d0 (3 sites). fixed vialayer(p, stack, i)(tree-mapa[i]); added a CPU dry run of_capture+ double/single block on tiny weights. launcher also hid the failure (exec exit 0) → now printsstage ok+ error tail. also fixedtar | grep -q+ pipefail SIGPIPE false negative. - D0 session 3: every splash/flash tiling failed "Failed to
deserialize the Mosaic module". cause: Colab image pairs jax 0.7.2 with
libtpu 0.0.21.1, but jax[tpu]==0.7.2 declares libtpu==0.0.23 — XLA
tolerates the older runtime, Pallas/Mosaic does not. fix:
tpu_job.ensure_libtpupins 0.0.23 for Pallas stages only (d0/d1), before jax import; report records libtpu + prior version. consequence: D-stage numbers are on a different XLA compiler than T1/T2 → compare only within session (the bench's current-sdpa lane is the in-session baseline). - D0 session 4 (libtpu 0.0.23): attention sweep complete — current
nn.sdpa5.497 ms/call (55.11 dB vs fp32 ref); best splash q2304/kv1536 1.182 ms, q1536/kv1536/c512 1.180 ms (54.57 dB); best flash q2304/m1536/k1536 1.161 ms (55.41 dB). ~4.7× per call, numerics unchanged. xla lane was wrong (BHLD passed to a BTNH API, -4 dB) — fixed. crashed next in block timing:_compilecalled the AOT executable with static args (num_heads; cfg/steps in denoise) — fixed at the helper; CPU dry runs now cover capture,_time_block,_denoise_bench, xla layout (11 tests). - D0 session 5: stage ok. blocks (p50): double 8.562 → splash 4.776 /
flash 4.881 ms; single 9.227 → 5.102 / 5.193 ms; attention-as-identity
2.498 / 2.763 ms (non-attention floor per block). full-DiT lane INVALID:
new
jax.jit(sampling.denoise)reused the cached unpatched trace (identical HLO, 784.9 vs 785.2 ms). fix:jax.clear_caches()after the rebind + a bit-identity guard against a pre-patch reference latent (first guard version compared against a retraced, also-patched call). - block-sum estimate for DiT with splash: 784 × (504/909) ≈ 435 ms — to be measured, not claimed.
- D0 session 6: DiT 779.0 → 387.2 ms (2.01×) with
flash q2304/m1536/k1536 (patch verified: latent differs, HLO 2421
lines). blocks: double 8.40→4.92, single 9.12→5.22 ms. D0 closed. est.
request ≈ 7.4 + 387.2 + 37.5 ≈ 432 ms (not measured e2e).
metrics-progress.mdcreated. - D1 delegated:
Klein4B.attentionswitch (explicit fn threading, no global patch), stage d1 with same-session sdpa-vs-flash latency + 96-pair official_ctx gate + step-latent SNR.
2026-09-26
— D1 implemented (attention switch in src/, stage
d1, scorer)
src/(the point of D1):Klein4B.attention: Literal["sdpa","flash"] = "flash"(static, so it is a jit cache key);nn.flash_sdpawraps the Pallas TPU kernel (D0's winner q2304/m1536/k1536, imported inside the function so a CPU import stays free);dit.forwardresolvesattend = flash_sdpa if cfg.attention == "flash" and jax.default_backend() == "tpu" else sdpaonce and threads it intodouble_block/single_blockas a parameter. Off-TPU the default falls back tosdpa, so every existing CPU test is unchanged. No module-global rebind anywhere — D0 proved a rebind is invisible to the trace cache.tools/bench_d1.py(new): 20-rep A/B of the 4-step DiT and the full resident request for sdpa vs flash with a hard guard that the two latents differ (the D0 silent-reuse failure, now a RuntimeError); text/DiT/VAE splits for flash; the 96-pairofficial_ctxlane (32 rev1 x 3 cached noise seeds) written as PNGs + packedstep0..3bf16 latents +flicker.quality_manifest/1; one archivequality-1024-jax-tpu-d1-<code16>.tar.gzwithquality/at the root.tools/modal_d1_metrics.py(new, Part 3): the L4 scorer. Fetches the archive from the dataset itself, verifies every candidate digest against the archive manifest and every oracle PNG/latent digest againstmanifest-verified.json, then LPIPS + DINOv2 (pinnedquality_metrics) andmetrics.step_snrper pair. The gate isminover per-pair medians (the harness statistic) plus LPIPS median and DINO p5, against the frozen floors re-read fromout/baseline/quality-floors.json(the local entrypoint refuses if they moved).- Blocked path, worth recording:
tools/modal_score_quality.pycannot score this gate.quality_harness.suite_gateasserts a production suite shape of32 x 1and readstests/prompts.json, which is now the oracle-lessquality-32x1-doodle(rev3) revision; the rev1 oracle is32 x 3 = 96pairs keyed by the rev1 suite (sha e4a8…). So the harness's 96-pairEXPECTED_PAIRSand its suite check contradict each other for a fresh run. The new scorer reproduces the harness's statistic directly instead of routing through a suite check that cannot pass. - Obsolete by design:
bench_d0._denoise_bench's monkeypatch lane no longer changes the DiT (that is exactly what D1 removed). Its CPU test now pins that fact — the unpatched lane runs and the rebind is reported inert — rather than asserting a patch that no longer exists. - Tests:
tests/test_attention_switch.py(4 cases),tests/test_bench_d1.py(6),tests/test_modal_d1_metrics.py(4, incl. a pin that the three gate constants equalquality-floors.json), plustests/test_bench_d0.py's re-pointed monkeypatch test. Suite: 175 passed, 1 skipped (176 collected, was 166). Nothing built for the TPU has been run — the v6e-1 session is the user's to launch (/tmp/d1_run.sh). - D1 PASS (96 pairs): LPIPS 0.00528 / DINO p5 0.98568 / SNR 33.75 dB.
request 828.9 → 435.7 ms same session; 2.17× vs frozen baseline. planner
fix before run:
flash_sdpatiles derived from L (nn.tile), sdpa fallback when L % 128. committed.
2026-09-26
— D2+D3 implemented (rope relayout, hoisted prologue, stage
d2)
- D3 — rope (
src/flicker/rope.py). Pre-flash op profile charged rope 87.1 ms of the 784 ms DiT scan (0.25 TFLOP/s at 1.28 TB/s — memory-bound):apply_ropeupcast q/k to fp32, reshaped to(...,64,1,2)and multiplied a(1,1,L,64,2,2)fp32 table whose trailing size-1/size-2 axes TPU vector tiles handle badly. The tables are nowRope(cos2, sin2), two(B,1,L,128)fp32 tensors —cos2repeats each pair's cosine on both lanes,sin2is-sinon even lanes /+sinon odd — so the rotation iscos2*x + sin2*pair_swap(x)over the raw 128-wide axis: same fp32 products, same sum, same fp32->bf16 cast, no reshape.pair_swapiswhere(even, roll(x,-1), roll(x,1));rope.concatjoins on the token axis;rope_freqsstill builds the reference packing (run_ladder's fixture is keyed on it). - Swap choice. Both forms implemented and priced; the
CPU measurement at the production shape (L=4608, from the vendored HEAD
package) is
where+roll2.2 ms vsreshape+flip7.6 ms vs HEAD's packed table 6.8 ms — andreshape+flipis the one that re-splits the 128-wide minor axis into 64x2, the exact shape class D0 identified. Shippedwhere+roll; the bench still measures both and reportsswaps.shippedby behaviour, so a TPU result can reverse it with a one-line edit. - Bit-identity (CPU). Eager-to-eager the new formula
is exactly equal to d734102's
freqs[...,0]*p0 + freqs[...,1]*p1on random q/k and on realimg_ids/txt_ids/joint tables (max|Δ| = 0.0); the full tiny-DiT forward is bit-identical to a HEAD capture. Underjax.jitat the production shape a CPU FMA may fuse either product of the odd lane'ssin*x0 + cos*x1, and a lane-uniform expression can only match one of the two choices — measured residue is one bf16 ulp on a handful of lanes (SNR 119.95 dB, max|Δ| 9.8e-4). Recorded, not hidden: the tiny-DiT A/B, the full-DiT A/B and the request A/B all come out bit-identical on CPU. - D2 — prologue (
src/flicker/dit.py,sampling.py).dit.prologue(p, cfg, x_ids, ctx, ctx_ids) -> Prologue(txt, pe_x, pe_ctx, pe)is the step-invariant half (txt_in(ctx)GEMM, both rope tables, their concat);dit.forward_from(p, cfg, x, t, pro)is the step-dependent half anddit.forwardtheir composition, so every existing caller is unchanged.sampling.denoiseanddenoise_trajectorynow share one_scanthat takes the prologue hoisted outside the Euler loop (modulations stay inside:vecdepends ontand D0 priced the whole set at ~1 ms). - Stage
d2(tools/bench_d2.py). A/B against the exact HEAD code:git archive d734102 src/flickervendored as a second real package (tools/_base/flicker_base, built by the launcher), so the two lanes are different functions with different jit caches, not a monkeypatch. Weights load once withflicker.loaderand the file header, both packages' key sets and the flattened tree are all asserted equal (fail loudly). Measures: the rope microbench (4 lanes on the captured(1,24,4608,128)q/k), the 4-step DiT (base vs new, 20 blocked reps), the resident request (base vs new, same cached noise), the sharedbench_d1._quality96-pair lane for the NEW path, and an XProf capture of the NEW DiT (3 iterations) laid out fortools/d0_op_profile.py --trace-root. Shipsquality-1024-jax-tpu-d2-<code16>.tar.gzwithquality/+profile/at the root. - Guard. D2/D3 expect bit-identical outputs,
so the D0 trace-reuse guard cannot be "the outputs differ":
_guard_distinct_pathsasserts the base and newrope.apply_rope,dit.forwardandpipeline._denoiseare distinct objects (and that the baseropehas noRope). - Not run here. No TPU session was created;
/tmp/d2_run.shis the user's to launch.
2026-09-27 — D2+D3 session: no win, not committed
- same session, vendored base (d734102) vs new, latents bit-identical: DiT 387.7 → 393.5 ms (0.985×), request 436.0 → 441.5 ms. rope microbench (1 call, real q/k): base 0.959, reshape_flip 0.811, where_roll (shipped by worker from CPU timing) 1.040 ms. CPU timing chose the wrong swap.
- all rope variants are ~10× over their byte floor (117 MB → 0.07 ms)
→ table layout is not the real cost. hypothesis: the "rope" bucket
carries the fused
heads()transpose (B,L,3,H,D)→(3,B,H,L,D). next: post-D3 op profile from the shipped trace, then decide between reshape_flip (−~15 ms max) and a head-layout change. - lesson: never pick a TPU variant from CPU timings — the bench measures both for a reason.
- post-flash op profile (
out/tpu/d2/op-profile.json, 393.1 ms/scan, reconciles +0.03 %): GEMM 160.7 (704 TF/s, at peak), flash 97.2 (270 TF/s), rope 82.3 (fp32 mul-add 26 + where/roll copies ~36), copies 40.7 (single-block linear1 split 18.2+6.7, head reshapes ~12), norms 5.6. - q/k/v prep (reshape + qk-norm + rope + concat) ≈ 125 ms vs a ~10 ms byte floor → the next big lever after the cheap fixes is a fused Pallas qk-prep kernel. D3b delegated: reshape_flip swap + load-time linear1 split, same-session A/B vs d734102.
2026-09-27
— D3b implemented (reshape+flip swap, load-time linear1 split, stage
d3b)
- V1 — rope swap (
src/flicker/rope.py).pair_swapis now thereshape (...,64,2)+ reverse reindex. The D2 session priced the three forms on the chip at the production shape: base packed 0.959 ms/call, reshape+flip 0.811, where+roll 1.040 — the CPU timing that picked where+roll in D2 was wrong for this chip, and where+roll also materialised_roll_staticslice fusions (~36 ms of a 393 ms scan).tools/bench_d2.pystill implements both, andshipped_form()names which onesrc/holds, sostage d3b's rope lane reports the swap by behaviour. - V2 — load-time
linear1split (src/flicker/loader.py,modules.py).single_blocks.linear1is one(hidden -> 3*hidden + 2*mlp)GEMM whose[qkv | mlp]cut XLA copied out of the(L, 27648)output (post-D3 profile: fusion.327 18.2 ms + copy.36 6.7 ms per scan).loader.split_linear1(tree, hidden)cuts the weight after loading — a pure partition of the same bytes, every other leaf shared — andsingle_prepare_qkvthen runs two GEMMs.dit_keys's checkpoint assertion is unchanged;export_jax_checkpoint.as_dit_treecalls the same helper somodal_export_checkpoint.runtime_comparestays leaf-for-leaf. CPU: the two leaves concatenate back bit-exactly, and the tiny-DiT forward with split weights is exactly equal to the unsplit reference (tests/test_linear1_split.py). - Stage
d3b(tools/bench_d3b.py). Three lanes against the vendored d734102 package:base,v1(this tree's rope, unsplitlinear1tree),v1v2(both). V2 is switched as a param tree, not a code fork:load_dit(..., split=False)leaveslinear1.weightand the unsplit branch ofsingle_prepare_qkvruns, while a split tree is a structurally different pytree, sojax.jitgives the two lanes distinct traces (asserted by_guard, the D0 lesson). A second vendored package would have needed a pre-V2 snapshot, which an uncommitted working tree cannot reproduce from git. Reusesbench_d2's base machinery, rope microbench, weight verification, profile andbench_d1._quality. The 96-pair lane runs only if V1+V2's latents are not bit-identical to base; otherwise the report records the gate as inherited from D1. Shipsquality-1024-jax-tpu-d3b-<code16>.tar.gzvia the sameship(archive/report names are params). d0_op_profile.MODULES_COPY_LINESfollowed the modules.py line drift (the split left the block).- Tests:
tests/test_linear1_split.py(6),tests/test_bench_d3b.py(8), plusbench_d2's_verify_weightsnow checks both key layouts. Nothing committed; no TPU session created —/tmp/d3b_run.shis the user's to launch.
2026-09-27 — D3b: wash, branch not merged
- same session vs d734102 (latents bit-identical): DiT base 386.8 / V1 389.7 / V1+V2 384.3 ms; request 434.9 / 437.8 / 432.4 ms. V1 (reshape_flip) won the microbench (0.766 vs 0.959) but lost in-DiT (+0.8 %) — fusion context differs. V2 (load-time linear1 split) −5 ms vs the ~25 ms the split copy suggested: the movement relocates, it does not vanish.
- decision proposed: keep
opt/dit-prep(b29c399) unmerged — ~135 lines for −0.6 %. XLA-level reshuffles of the q/k/v prep are exhausted (3 attempts); next lever is a fused Pallas qk-prep kernel (then int8). - lesson: microbench wins on fusible elementwise ops do not transfer — judge only at the DiT level.
- post-D3b op profile (384 ms/scan,
out/tpu/d3b/op-profile.json): GEMM 165.9, flash 97.5, rope 60.0 (~33 ms of it materialised rev/copy from reshape_flip), copies 15.3 (split copy gone), norms 15.9 + qk-norm multiply 14.1. q/k/v prep total ~114 ms (was ~128): moved, not removed. - D3c delegated: fused Pallas qk-prep kernel (norm + rope + head
transpose via BlockSpec + concat via aliasing) on new branch
opt/qk-prepfrom main; CPU interpret-mode bit-exactness first.
2026-09-27
— D3c implemented (fused Pallas qk-prep kernel, stage
d3c)
Branch opt/qk-prep from main (d734102);
opt/dit-prep (b29c399) is not merged and not built on. The
three XLA-level attempts moved the q/k/v prep between buckets, so this
is the kernel.
src/flicker/kernels.py(new).qk_prep(qkv, q_scale, k_scale, freqs, num_heads)— one Pallas TPU kernel that reads the(B, L, 3*H*D)projection output once and writes q/k/v(B,H,L,D)once, doing theheads()transpose (folded into the outputBlockSpecindex map plus one in-register(rows,H,D)->(H,rows,D)permute),qk_normandapply_rope.vis a pure layout copy.Grid over rows only, the block carries all 24 heads — head-tiling the DMA would cut each
3*H*Drow into 24 strided fragments; the output store writes each head's rows as one contiguous run.ROW_TILES = (512, 256, 128, 64): at rows=512 the program's working set is ~19 MB (input 9.4 + three 3.1 MB outputs), and the next legal size for L=4608 is 2304 (85 MB) which no single program holds. The stage sweeps 1152/1536/2304 behindtryso the chip can overrule that.Cast points are the chain's, verbatim: fp32 mean of squares + eps -> rsqrt -> multiply -> bf16 -> times the bf16 QKNorm scale; then fp32 adjacent pairs -> bf16.
lane_pairderives the(L,128)cos/sin lanes from today's packed(1,1,L,64,2,2)table once per step, outside the scan.CPU interpret-mode numerics (
tests/test_kernels.py, against the jitted chain — eager and compiled differ by up to a bf16 ulp on the rope's odd lane, the D2/D3 caveat).vis bit-exact in every case; q/k, as bf16 ulps of the tile's largest element and SNR in dB:case grid q k L=64 H=4 D=32 1 exact exact L=512 H=8 D=64 1 exact 0.000 ulp, 157.9 dB L=512 H=8 D=64 2 1.000 ulp, 51.2 dB 0.500 ulp, 51.0 dB L=1152 H=24 D=128 1 0.062 ulp, 114.7 dB 0.125 ulp, 108.2 dB The chain's RMSNorm multiply runs over the whole
(B,H,L,D)tensor and the kernel's over one(rows,H,D)tile, so XLA vectorises them differently: at 2+ grid steps ~28 % of q/k elements land on the other side of a bf16 rounding. At the production width with one program it is 1/8 of a bf16 ulp. Not bit-identical, by construction — reported, not hidden; the 96-pair lane runs because of it.Wiring.
Klein4B.qk_prep: Literal["xla","kernel"] = "kernel"(static, so it keys the jit cache), resolved indit.forwardnext toattend; CPU always takes the XLA path, so every existing CPU test is unchanged.modules.qkv_prepdispatches and keeps today's chain for CPU and for lengths with no legal row tile. The double block calls it once per stream with its own slice of the joint rope table — rope is per token, so the joint table just splits and the[txt|img]join happens on prepared q/k/v, exactly the concat D1 already performs. The XLA fallback is the previous code verbatim (double_prepare_qkvbranches onfreqs is Nonebefore any restructure) so the bench can assert the rewiring is inert: CPU, thexlalane is bit-identical to the vendored d734102 package on the whole tiny forward.Stage
d3c(tools/bench_d3c.py,tpu_job.PALLAS_STAGES,tpu_correctness). Three lanes against the vendored d734102 package:base,xla(must be bit-identical to base or the stage raises — otherwise the A/B does not isolate the kernel),kernel. Prep microbench on the real projection outputs of one single block and both double streams over every legal tile; 4-step DiT and resident request p50 (20 reps); latents vs base; compiled-HLOtpu_custom_callcount per lane (base flash-only, so a reused trace is impossible — stage raises if the kernel lane does not add one); XProf capture ford0_op_profile; the 96-pair lane only if a latent moved. Shipsquality-1024-jax-tpu-d3c-<code16>.tar.gz.Local-jax trap worth recording:
interpret=Truein jax 0.11.2 drops every grid step's write but the first and the last once the grid has 3+ steps (reproduced on a two-line copy kernel; the mosaic interpret path mis-slices the input instead). The kernel tests therefore use 1- and 2-step grids and pinrow_tileseparately. This is a CPU-emulation bug only; the TPU lowers through Mosaic.Tests:
tests/test_kernels.py(14, incl. a forced end-to-end run of the whole tiny DiT throughdit.forwardwith the kernel selected) +tests/test_bench_d3c.py(15). Full suite 168 passed, 11 skipped, 0 failed (179 collected, 875 s). Tests written against the dit-prep src are skipped, not deleted (test_blocks,test_primitives,test_rope_layout,test_linear1_split,test_bench_d2,test_bench_d3b,test_sampling_observer, plus two intest_export_checkpointand one intest_bench_d0), guarded on the absence of the dit-prep symbols.tools/d0_op_profile.py'sMODULES_COPY_LINESwas re-pointed for this branch'smodules.py(the D3c import shifted every line below it by one, and the branches moved the concats): it now namesheads/merge_heads, the fourdouble_prepare_qkvconcats andsingle_prepare_qkv's cut. Thedense_gemmline range was widened by one formlp_embedder. Without this the D3c profile'scopiesbucket would have been credited lines that are now the output projections.Known, left to the user: a few
tools/files still carry dit-prep symbols and therefore do not run on this branch —run_ladder.py:188andbench_d0._time_block'srope.concat(pe_ctx, pe)(the packed table concatenates on axis 2, so a one-linejnp.concatenatefixes either), andbench_d2.stage_d2/bench_d3b.stage_d3b/export_jax_checkpoint.as_dit_tree(which call the load-time split). D3c's stage uses only helpers verified by the CPU dry runs (_capture,_measure,_compile,_numerics,bench_d2._quality_lane), so it is unaffected.Nothing committed; no TPU session created —
/tmp/d3c_run.sh(and/tmp/d3c_fetch.sh) are the user's to launch.D3c review (planner): bug —
kernels.qk_prepBlockSpec index maps returned element offsets (i*tile_rows) instead of block indices (i). Grid 1-2 passed by clamping luck; grid ≥3 corrupted middle tiles; the worker misattributed it to a "jax interpret-mode bug". Fixed; tests now include 9-step grids (576/64 and 4608/512) and pass (16/16). Would have corrupted the TPU DiT (grid 9).D3c session 1: kernel failed to lower on every tile — Mosaic
NotImplementedError: Only 2D gather(strided lane slicesx[...,1::2]), plus 4-D reshape + in-register 3-D transposes. CPU interpret mode is plain JAX and cannot reveal Mosaic's restrictions. planner rewrite: grid (row tile, head), BlockSpecs slice each head's 128-wide q/k/v columns from the projection output, output index map (0,h,i,0) does the transpose; body is 2-D only: lane-mean RMSNorm,pltpu.rollpair swap + parity select. ROW_TILES now (2304,1536,1152,512,256,128,64) — tiles are (rows,128), tiny. 31 tests pass.D3c session 2: DiT 387.6 → 298.6 ms, request 435.8 → 346.9 ms (2.72× vs frozen baseline). gate PASS (LPIPS 0.00497, DINO p5 0.98435, SNR 35.65). prep sweep: single 2304 rows 0.351 ms vs 128 rows 0.759. post-D3c profile 297.6 ms/scan: GEMM 161.3 (54 %, 701 TF/s), flash 97.6, copies 22.7 (18.4 = single-block linear1 split again), kernel ~12.3, norms 2.4, rope 0.3. committed 5f1b731, main fast-forwarded, tags d1-flash / d3c-qk-prep. scorer output now per stage (d3c overwrote d1's local json once; d1 numbers kept in results §9, original in dataset history 92a4458).
2026-09-27
— D4 implemented (batch sweep, W8A8 int8 block GEMMs, load-time linear1
split; stage d4)
Branch opt/d4 from main (5f1b731) — D3c
shipped — plus the uncommitted batch-axis change to
kernels.qk_prep (grid (batch, row_tile, head),
index maps take (b, i, h)); opt/dit-prep is
still unmerged and not built on. The D4 A/B base is main itself
(5f1b731), not D3c's d734102.
- int8 (
nn.py+config.py+loader.py).Int8Weight(values: (…,in,out) int8, scale: (…,out) fp32);quantize_weight= symmetric per-output-channel absmax/127;quantize_rows= dynamic per-token absmax per call;linear_int8= int8×int8→int32dot_general+ fp32 dequant + one cast to the activation's dtype.nn.lineardispatches on the leaf's type, so quantization is a load-time choice and a staticKlein4B.gemm(bf16/int8/int8_mlp) keys the jit cache. Applied to the stacked tree, soscalecarries the block axis andlax.scanslices it like any leaf. Named keys: doubleimg/txt_attn.qkv,img/txt_attn.proj,img/txt_mlp.0,img/txt_mlp.2; singlelinear1.weight(or its split halves),linear2.int8_mlp= the MLP halves only. Load-time cost: one pass over the DiT weights (int8 halves the block bytes: 7.7 → ~3.95 GiB). - split (
loader.split_linear1,modules.single_prepare_qkv) — theopt/dit-prepb29c399 design ported verbatim onto the D3c code;single_prepare_qkvdispatches onlinear1_qkv.weightbeing present, so the qk-prep kernel still reads the qkv GEMM's output unchanged.load_dit(path, cfg, split=False, gemm="bf16")— both default off, so every pre-D4 caller (and the vendored baseline) keeps the checkpoint's leaf layout; the D3b wash is not silently promoted to default. - Stage
d4(tools/bench_d4.py,tpu_job.PALLAS_STAGES,tpu_correctness): five arms (prod/baseshare one tree, differing only in package;split,int8,int8_mlp), the batch sweep, two full-request XProf captures, the 12-shape int8 microbench, the pre-registered candidate rule and one 96-pair lane per candidate.prodvsbasebit-identity at B=1 is the guard that the batch sweep measures main's production path and not a fork of it. - Pre-registered candidate rule: ship a 96-pair lane
for an int8 arm iff its 4-step DiT p50 beats bf16 and
its latent SNR vs bf16 is ≥ 26 dB (a sanity floor far below the ~33 dB
regime the gate lives in). One candidate →
quality-1024-jax-tpu-d4-<code16>.tar.gz; two → a-int8/-int8mlpsuffix on each, andmodal_d1_metrics.out_fornow keeps their local result paths apart (the d3c overwrite, again). The faster candidate's archive also carriesprofile/fortools/xplane_to_perfetto.py <archive>/profile/trace. - Local (CPU) evidence, no TPU session —
/tmp/d4_run.sh+/tmp/d4_fetch.share the user's to launch. int8 round trip: weight and activation relative error 3.9e-3 (= 0.5/127) on Gaussian data, a random linear at 39.4 dB SNR; the tiny stage-B golden DiT forward at 51.4 dB (int8) / 51.7 dB (int8_mlp) and not bit-identical to bf16 (so the D0 silent-reuse guard can fire); the split tree forwards bit-identically to the unsplit one (max|d| = 0), and the two leaves reassemble the checkpoint leaf exactly. - Tests:
tests/test_bench_d4.py(26) — quantize/dequantize round trip + per-channel/per-token scale shape, tiny DiT int8 SNR, split purity + bit-identity,_throughput/_item0/_candidates,_batch_lanefailure-stop and kernel-name guards,_batch_caseend to end on stubs (the "dry-run everything that is not the accelerator" lesson: noise replication, B distinct prompts, stage compiles, latent→z unpack),_keyed/_quantized, archive layout,out_forvariants, dispatch. Two pre-existing tests were adjusted for the branch:test_export_checkpoint's native-reader test now asks forsplit=True(it compares againstas_dit_tree, which splits), andtest_bench_d3c._base_or_skipskips whentools/_baseholds a post-D3c revision (the D4 launcher rebuilds it from 5f1b731; D3c's own A/B needs d734102).
2026-09-27 — D4: batching, int8, full-request profile
- batch sweep (full request, img/s): B1 2.891 | B2 2.281 | B4 2.180 | B8 2.700 | B16 2.648 → B=1 wins. DiT per image grows with B (298 → 313 → 330 → 332 → 336 ms): at 4608 tokens/GEMM the MXU is already saturated at B=1, batching only adds work + overhead. VAE per image is pathological at B=2/4 (115-117 ms vs 37 at B=1) and better at B≥8 (24 ms) — XLA picks different conv/attention strategies per B. item0 at B>1 not bit-identical to B=1 (different tiling), expected.
- linear1 load-time split: DiT 297.7 → 299.7 ms — no gain on top of D3c; not adopted.
- int8 microbench: 1.6-1.7× on the big GEMMs (single linear1 1.70×, double img mlp0 1.60×), ~1.0-1.1× on proj/txt/mlp2 shapes; per-GEMM SNR 30-45 dB. DiT: int8 297.7 → 245.5 ms, int8_mlp → 275.7 ms. pre-registered candidate rule (latent SNR ≥ 26 dB): int8 rejected (25.51 dB), int8_mlp shipped. int8_mlp gate FAIL: LPIPS 0.0327 (5.1× floor), DINO p5 0.944, step SNR 25.3 dB. naive per-token W8A8 is not acceptable for this DiT; next attempt must be outlier-aware (SmoothQuant-style).
- full request B=1 op profile
(
out/tpu/d4/op-profile-request.json): 344.9 ms/iter device, 4.3 ms idle, busy 98.8 %; DiT dominates; VAE'supsample_nearestbroadcast/reshape ≈ 6 ms, VAE attention ≈ 2 ms. tool fix:d0_op_profilenow takes the region name for both lookups.
2026-09-27
— D5 implemented (SmoothQuant int8, sub-pixel VAE upsample, one fused
request; stage d5)
Branch opt/d5 from main (9c8b6d8); the
D4 int8 code was taken over from opt/d4 as four files
(git checkout opt/d4 -- src/flicker/{nn,loader,config,modules}.py)
and extended. opt/d4 is not merged and not built on. The
A/B base is main itself.
- Arm A — SmoothQuant (
nn.py,loader.py).Int8Weightgains a third fieldsmooth: Array | None(the fp32 per-input-channel divisor), so the plain D4 path is unchanged (None) and the smoothed one isquantize_rows(x / smooth)inlinear_int8— one fused elementwise, the whole runtime cost of the outlier handling.nn.smooth_scales(x_absmax, w_absmax, alpha)is the formula;nn.quantize_weight_smooth(w, s)foldsdiag(s) win fp32 once and then quantizes per output channel.loader.fold_smooth(tree, mode, absmax, alpha)walksINT8_MODES[mode], reads the leaf's own per-input-channel absmax and looks up the calibration's;SMOOTH_MODES = ("smooth", "smooth_large")andquantize_ditnow refuses them (a fold without statistics would silently be D4 int8).gemmgains those two literals; the unsplitlinear1.weightis the leaf (D4 measured no gain from the split). - Calibration.
bench_d5._tap_double/_tap_singlearemodules.double_block/single_blockwith the ten quantized GEMMs' inputs emitted as taps (the four the block computes but does not keep are recomputed from the same expressions),_tap_forwardisdit.forwardwith those as the block scans'ys, and_tap_denoiseissampling.denoisewith them as the Euler scan'sys. 8 rev3 prompts (tests/prompts.json, the doodle suite — not the rev1 gate prompts) with the cached seed-1 noise, max over the 4 steps and then over the prompts. The first prompt re-checks the tap forward's velocity againstpipeline._denoisebit for bit and the stage raises if they differ: if the taps are not the real GEMM inputs the fold is meaningless. - Arm B — sub-pixel VAE (
modules.py,vae.py).nearest(2) + 3x3 SAME convis exactly one 3x3 SAME conv on the low-res input with the four output phases' taps folded into one(3,3,in,4*out)kernel (phase_kernels,_PHASE_TAPS), then depth-to-space.VAE.upsampleis the static switch. - Arm C — one fused request
(
pipeline.py).request_fusedcomposestext_encoder.encode,sampling.denoise,vae_decodeand a deviceto_uint8(to_uint8_device) into onejax.jit(_fused), so one dispatch covers the request and the host receives uint8;to_uint8's axis rule was factored into_chw_to_hwcso both paths share it.generate_fuseddrawsnoiseexactly asdenoise_fromdoes. - Stage
d5(tools/bench_d5.py). Eight arms in one session vs the vendored 9c8b6d8 package, each non-reference one (and every 96-pair lane and the trace) behind_maybeso a failure is recorded inreport["errors"]rather than killing the session, and with a fold fingerprint per candidate (four folds must be four different weight sets — the D0 silent-reuse guard, for the fold);prodvsbaseimage identity is the guard that the A/B measures main's production path. Per arm: DiT and full-request p50 (20 blocked reps), the three stage splits, compiled-HLO custom calls and the per-step latent SNR vs bf16;subpixel's latent must be bit-identical to base's (it is VAE-only, so its gate is images) andfusedrecords image identity plus two dispatch-only lanes (the three stages in one python call vs the one fused jit) as the "no inter-stage dispatch" evidence. - Pre-registered (written in the docstring before
measuring): a SmoothQuant candidate ships a 96-pair lane iff
its 4-step DiT p50 < bf16's and its final latent SNR
vs bf16 ≥ 30 dB, at most the two fastest;
subpixelalways ships (it changes pixels);fusedships only if its image is not bit-identical; the traced configuration is the fastest shipped candidate + subpixel iff it won on VAE p50 + the fused path iff its request p50 won, captured as regionrequest_combined. - Local (CPU) evidence, no TPU session —
/tmp/d5_run.sh+/tmp/d5_fetch.share the user's to launch. Fold identity:(x/s) @ (s w) == x @ wup to the int8 round trip, and on outlier-heavy activations the smoothed path is 43.3 dB vs 34.6 dB unsmoothed; tiny golden DiT forwardsmooth_large53.5 /smooth52.2 dB vs bf16, neither bit-identical. Sub-pixel: fp32 131 dB (max|d| 3.3e-6) at every real upsampler, bf16 51.6-51.7 dB, and through the whole decoder at a 4x4 latent 45.1 dB (the VAE's own bf16 band vs torch is 40-48 dB) while running 12.5 s -> 1.8 s on CPU. Fused:to_uint8_devicebyte-identical toto_uint8(corners and truncation included), andrequest_fusedreproducesgenerate_residenton stubs. - Tests:
tests/test_bench_d5.py(30) — the fold/scales,fold_smooth's refusals, the tap forward's bit-identity + a numeric check of one tap against an independent recomputation, the per-step taps, the VAE equivalence at both levels, the uint8/fused plumbing, the candidate rule (both bounds, the cap),_compare's guards, the archive layout,out_for's new variant parse and the dispatch. Suite: 222 passed, 16 skipped, 0 failed (238 collected). - Launchers.
/tmp/d5_run.shrebuildstools/_basefrom9c8b6d8and checks 15 revision patterns, each verified againstgit show 9c8b6d8:src/flicker/<file>(3 present-patterns match, 12 absent-patterns do not);/tmp/d5_fetch.shbrings home the newest run's whole lane set.
2026-09-27 — D5 session 1 (partial)
- fused request (one jit, uint8 on device): 347.1 → 344.3 ms (−2.8 ms). dispatch 1.13 → 0.66 ms.
- VAE sub-pixel upsample: 37.2 → 48.9 ms (slower) — XLA runs the 4×C_out 3x3 conv at low res worse than nearest+conv at high res. rejected on latency.
- SmoothQuant arms: OOM at load —
fold_smoothupcast whole stacks to fp32 (linear1 stack 6.3 GiB, 4.2 GiB free). fixed:loader._fold_per_block(one block's fp32 at a time, ~340 MB). re-running.
2026-09-27 — D5 session 2 (VM died after the trace; quality archives shipped)
- same session vs main 9c8b6d8: base DiT 297.9 / request 346.1 ms. fused request 343.4 (−2.7 ms). subpixel VAE 48.9 ms (vs 37.2) → rejected. SmoothQuant DiT: a050-all 249.7, a080-all 249.8, a050-large 250.8, a080-large 250.9 ms. combined (sm-a050-large + fused) request 297.1 ms. only sm-a050-large passed the ≥30 dB pre-screen → the two big GEMMs (single linear1, double img mlp.0) carry ~98 % of the int8 speedup.
- 96-pair gates: sm-a050-large FAIL (LPIPS 0.0122,
DINO p5 0.9743, step SNR 32.50 vs 33.19 floor — vs naive int8_mlp
0.0327/0.944/25.3); subpixel PASS (0.00497/0.98405/35.65) but slower →
rejected; fused "FAIL" (0.0420/0.9361/35.65) is a lane-design artefact:
request_fusedruns the JAX text encoder while the official_ctx lane feeds cached official ctx → its error equals the known native_text gap (0.041). fused needs a byte-identity check vs staged with the same text path. - lost: final report.json + request_combined trace (VM died while shipping). lesson: ship report and trace before the quality lanes; the VM has now died twice late in long sessions.
2026-09-27
— D6 implemented (four one-variable SmoothQuant folds, fused
byte-identity, early shipping; stage d6)
Branch opt/d5 (D6 is built on the D5
tree, uncommitted and not committed by this work). The A/B base is still
main 9c8b6d8: D6 spends no new mechanism, it spends the
neighbourhood of the D5 near-miss (sm-a050-large: both
large GEMMs, α=0.5, DiT 250.8 ms, gate FAIL LPIPS 0.0122 / DINO p5
0.9743 / step SNR 32.50 vs 33.19) — and it re-measures that arm
in the same session as the bar.
- src.
loader.INT8_MODESgains the two single-GEMM isolatessmooth_linear1(unsplitsingle_blocks.linear1.weight) andsmooth_mlp0(doubleimg_mlp.0.weight), which are disjoint and whose union is exactlysmooth_large— that identity is what makes "drop one of the two large GEMMs" one design variable, and it is asserted inbench_d6._guardand in the tests.SMOOTH_MODESbecomes the four smooth modes;config.Klein4B.gemm's Literal grows the two isolates. No other src change: the fold, the calibration taps and the fused request are D5's. - Arms (
tools/bench_d6.py, thin — it importsbench_d5's_measure_arm,_calibrate,_per_step_snr,_fold_fingerprint,_maybe,_trace_combinedandship).prod(bf16),base(the vendored 9c8b6d8 package on the same tree), the referenceslg-a050, and the four candidatessl1-a050,sl1-a065,slg-a065,slg-a035; calibration exactly D5's (8 rev3 prompts, seed 1, max over the 4 steps, never the gate prompts). Two D5 helpers were generalised for reuse instead of copied:bench_d5._compare(rows, latents, images, steps, lanes=…, smooth_lanes=…)andbench_d5.ship(…, report=…). - Pre-registered rule (written in the docstring before
measuring). A candidate ships a 96-pair
official_ctxlane iff its 4-step DiT p50 < bf16's and its final latent SNR vs bf16 ≥ the reference arm's own final latent SNR from this same session; at most 3 lanes, ordered by that SNR, highest first; every rejection records its numbers and its reason, and a reference that does not measure means no bar and no lanes. Fused: no lane —generate_fusedvsgenerate_residentover all 32 rev1 prompts at seed 0, both on the native text path (the D5 fused lane's 0.042 LPIPS was the native-text gap, not the fusion); byte-identical ⇒ the D3c gate carries over, otherwise a recorded per-prompt failure and the combined request falls back to the staged path. Combined: highest-SNR passing candidate + the fused entry point, traced asrequest_combined. - Shipping order is the D5 lesson, encoded. The
report archive
(
quality-1024-jax-tpu-d6-report-<code16>.tar.gz, carryingquality/d6_report.json+profile/) is written and shipped before the first quality lane, each lane archive (…-d6-<variant>-<code16>.tar.gz) ships the moment its lane finishes, and the report is re-shipped under the same name at the end.d6_fetch.shtherefore cannot use D5's "newest run's whole set" rule (the final re-ship would be newest and drop every lane): it keeps the newest archive per variant. - Local (CPU) evidence, no TPU session —
/tmp/d6_run.sh+/tmp/d6_fetch.share the user's to launch. The isolates fold only their own leaf and leave the other bf16, the latent moves (not a shared trace) and the tiny golden DiT forward is 54.29 dB (smooth_linear1) / 54.89 dB (smooth_mlp0) vs bf16; the five D6 folds have five distinct fingerprints;_vars_from_referencereports one moved design variable forsl1-a050/slg-a065/slg-a035and two forsl1-a065(it is the corner of the leaf-set × α grid — the "one variable" framing holds for three of the four and the field says so rather than hiding it). - Tests:
tests/test_bench_d6.py(18) — the fold table's union/disjointness invariant, the isolates' leaf sets and SNR, the five distinct fingerprints, the one-variable record, the rule (bar vs fixed floor, the cap of 3 ordered by SNR, a failed reference ⇒ no bar, a failed candidate, a slower arm), the fused identity (identical and mismatched, recorded not raised), the report/lane archive layout andout_forvariants, stage registration, and a structural check that bench_d6 defines none of bench_d5's helpers. One D5 test was updated (SMOOTH_MODESis now a 4-tuple). - Launchers.
/tmp/d6_run.shrebuildstools/_basefrom9c8b6d8and checks 17 revision patterns, each verified againstgit show 9c8b6d8:src/flicker/<file>(3 present, 14 absent; the two new ones are D6's isolate names); the bundle's 32 members were verified present in a locally built bundle./tmp/d6_fetch.shunpacks the report (+ trace) and every lane, newest per variant.
2026-09-27 — D6 (session completed, early ship worked)
- same session: bf16 DiT 298.5 / request 346.8 ms. reference slg-a050 latent SNR 30.73 dB. sl1-a050 (linear1 only) 256.5 ms / 30.43 dB; sl1-a065 256.4 / 28.37; slg-a065 250.9 / 28.00; slg-a035 250.9 ms qualified (only one). linear1 carries nearly all the int8 error.
- slg-a035 96-pair gate FAIL: LPIPS 0.0120, DINO p5 0.9793, step SNR 32.34 dB — same plateau as D5 (0.0122 / 0.9743 / 32.50). per-token W8A8 + SmoothQuant saturates at ~LPIPS 0.012 / ~32.4 dB.
- fused vs staged (same native text path): NOT byte-identical, 32/32 prompts, max|Δ| 5 uint8 — one graph changes XLA's fusion at stage boundaries. −2.7 ms not worth its own gate → rejected.
- round closed. production = main 9c8b6d8: 346 ms, 2.89 img/s. int8 tier (~299 ms, LPIPS 0.012) is a user policy decision (quality budget vs the implementation floor), not merged.
2026-09-27 — gallery session + article assets
- int8 opt-in tier on main (8d11fc5, pushed):
Klein4B(gemm="smooth_large")+flicker.calibrate.absmaxloader.fold_smooth/save_calibration/load_calibration. calibration file shipped:int8-calibration-smooth_large-a035.safetensors(sha 7ffb245f…). same session: request bf16 346.9 → int8 299.6 ms (1.158×).
- 32 rev1 prompts × {bf16, int8} end-to-end (native text), seed 0 →
out/view/gallery/; viewer columns jax_bf16 / jax_int8 (pixel PSNR vs torch). bf16↔︎int8 mean |Δ| 2.29 uint8. - first gallery launch:
colab newAPI read timeout (network), no session created; a live[hb]session belonged to the parallel hummingbird job — left alone. retry succeeded. - figures: out/figures/*.png (8 charts, tools/make_charts.py); Perfetto: out/figures/traces/{baseline, current,int8,compare} (tools/trace_shots.py, tools/trace_windows.py = same 1000 ms axis).
- article republished with charts, TPU-characteristics table, before/after traces.
2026-10-01 — reference: upstream maxdiffusion klein-4B on v6e-1 (outside flicker)
AI-Hypercomputer/maxdiffusion @ 1bc5481,
unmodified, own venv on a Colab v6e-1 (session mdx,
stopped): python 3.12, jax 0.11.2, libtpu 0.0.49, flax
0.12.10, tokamax 0.0.14 (their
generated_requirements, resolved today). 1024², 4 steps,
bf16, default prompt, 20 timed reps after AOT compile + warmup. Tool
tools/bench_maxdiffusion.py; logs, images,
report.json in out/tpu/maxdiffusion/.
| variant | stage sum p50 | e2e p50 | Qwen3 / denoise / VAE (ms) | img/s | AOT compile |
|---|---|---|---|---|---|
| flash (splash, shipped config), B=1 | 463.5 ms | 553.4 | 8.7 / 421.3 / 33.5 | 2.157 | 68.7 s |
| dot_product, B=1 | 512.6 ms | 602.8 | 8.7 / 470.5 / 33.4 | 1.951 | 70.0 s |
| dot_product, B=4 | 2581.5 ms | 2929.3 | 27.9 / 2152.8 / 400.9 | 1.549 | 22.7 s |
| flash, B=4 | compile fails | — | — | — | — |
- command:
python src/maxdiffusion/generate_flux2klein.py src/maxdiffusion/configs/base_flux2klein.yml timing=True num_reps=20 height=1024 width=1024 num_inference_steps=4 per_device_batch_size={1.0|4.0} [attention=dot_product]. - stage sum = Qwen3 + denoise + VAE decode, each bracketed by
block_until_ready— the boundary comparable to flicker's request. e2e adds PNG saving (87.6 ms at B=1) and ~2.5 ms of host gaps. spread is tiny (flash B=1 463.3–463.6 ms over 20 reps; log resolution 0.1 ms), so p50 ≈ mean. - vs flicker (same chip type, different session and toolchain: flicker ran jax 0.7.2 / libtpu 0.0.23): production 345.9 ms is 1.34× faster than maxdiffusion's 463.5; maxdiffusion is 2.04× faster than the frozen baseline 944.67. per stage: DiT 421.3 vs 298.0, text 8.7 vs 7.3, VAE 33.5 vs 37.2 (theirs is faster).
- their splash kernel buys 10 % over their dot-product (470.5 → 421.3); flicker's flash bought 2× over ours, so their dot-product path is already far better than our frozen one (470 vs 781 ms DiT).
- flash B=4:
RESOURCE_EXHAUSTED: E1001 CompileTimeScopedVmemOom … splash_mha_fwd_segmented_no_residuals … Scoped allocation with size 39.03M and limit 32.00M— the shippedblock_q 4608does not fit vmem at B=4. not retried with smaller blocks. dot_product B=4 is slower per image than B=1 (645 vs 513 ms), VAE 100 ms/img. - peak HBM 13.7 GiB (
peak_bytes_in_use, read at exit). load 12.0 s (weights already cached on the VM disk). - caveats: Colab lower bound; one prompt, one session; quality not
gated (image eyeballed only:
out/tpu/maxdiffusion/flash_b1.png); transformers 5.18 resolved although their base list says<5.0.0. - first launch failed: uv resolved against the VM's python 3.13 (torch
cp312-only wheel) — fixed by
--python <venv>/bin/python. token file deleted on the VM by the chain and locally by the trap;colab sessionsempty.
2026-10-01 — 512² and a same-session A/B: flicker vs maxdiffusion on one v6e-1
One Colab v6e-1 session (res, stopped), both engines
back to back, same prompt, text / denoise / VAE each closed by
block_until_ready, p50 of 20 reps after compile + warmup.
flicker 8d11fc5 on jax 0.7.2 / libtpu 0.0.23; maxdiffusion
1bc5481 on jax 0.11.2 / libtpu 0.0.49. Tool
tools/bench_res.py; logs and report.json in
out/tpu/res512/.
| case | flicker | maxdiffusion, dot-product | maxdiffusion, flash (shipped) |
|---|---|---|---|
| 512² B=1, stage sum | 95.3 ms (7.3 / 79.6 / 8.4) | 112.2 ms (8.6 / 95.2 / 8.4) | 149.7 ms (8.6 / 132.7 / 8.4) |
| 512² B=1, img/s | 10.49 | 8.91 | 6.68 |
| 1024² B=1, stage sum | 343.0 ms (7.3 / 298.5 / 37.2) | — | 462.9 ms (8.6 / 420.9 / 33.4) |
| 512² img/s by batch | B=1 | B=2 | B=4 | B=8 | B=16 |
|---|---|---|---|---|---|
| flicker | 10.49 | 9.06 | 8.73 | 10.51 | 10.16 |
| maxdiffusion, dot-product | 8.91 | 7.04 | 6.25 | 7.09 | 6.58 |
- 1024² is now a same-session A/B: flicker 1.35× faster (343.0 vs 462.9), matching the cross-session 1.34×. flicker's request p50 (with host tokenise + uint8) is 346.7 ms at 1024², 96.1 ms at 512².
- 512²: flicker is 1.18× faster than maxdiffusion's best setting and 1.57× faster than its shipped config. the whole gap is the DiT (79.6 vs 95.2 ms); text and VAE are level.
- maxdiffusion's shipped flash config is slower than its own
dot-product at 512² (132.7 vs 95.2 ms denoise), the reverse of
1024². its
block_qstays 4608 for a 1536-token sequence — the failed compile dumpsf32[B,4608,128]operands — so the kernel appears to pad 3× (inferred from the dump, not profiled). - maxdiffusion flash fails to compile at every B ≥ 2 at 512²
(
E1001 CompileTimeScopedVmemOom), as at 1024² B=4. - batching does not pay at 512² either: flicker B=8 equals B=1 (10.51 vs 10.49 img/s); maxdiffusion peaks at B=1. both engines show the same VAE dip — B=2/4 cost 27 / 28 ms per image vs 8.4 at B=1 and 5.3 at B=8 (flicker; maxdiffusion 24 / 25 / 8.4 / 4.7) — so it is not specific to flicker (cause not profiled).
- caveats: two toolchains (each engine on its own), one prompt, quality ungated for maxdiffusion, Colab lower bound. the status watcher lost its connection mid-run; results were fetched after the chain finished.
- charts (
tools/make_charts.py, wide +_mobile):klein_512_frontier,klein_512_batch,klein_res_latency,klein_512_stagesinout/figures/.