One TPU chip, one image: klein-4B on a Colab v6e-1
FLUX.2 klein-4B in JAX, bf16, batch 1, four Euler steps, text encoder
and VAE included, on one Colab v6e-1 chip: 32 GiB, 918
TFLOP/s, 1638 GB/s, ridge 560 FLOP/byte [S]/[D]. Resolutions 512²
(L=1024), 1360×768 (L=4080) and, for the 32 GiB headroom question, 1024²
(L=4096), 512 text tokens; 45.666, 150.309 and 150.920 TFLOP per image
[D]. Every latency is a warmed median with
jax.block_until_ready() around the region and the sample
count in the JSON (10 per stage, 2 per serving shape after the first
request); XLA compile, the first post-compile call and the 13.3 GB of
weight staging are reported separately, and the chip's spec block
travels with the numbers. The harness is
tools/bench_tpu.py; the FLOP counts are
tools/roofline.py's, imported, not re-derived.
1. What a single chip changes
A one-chip run deletes the communication half of the cost model.
jax.device_count() is 1 [M], so every collective in
docs/roofline.md §5 costs exactly zero — and is no longer a
lever: FSDP-8's all-gather (16.96 ms/image at 8 chips), Ulysses (0.26
ms) and tensor parallelism (1.45 ms) [D] all vanish, and with them the
layout frontier. What is left per module is
max(math, memory) against the chip's own peak and bandwidth
— the roofline's half of the result, §5.1.
| chip | bf16 TFLOP/s | int8 TOPS | HBM GiB | HBM GB/s | ridge FLOP/byte | floor ms 512² / 1360×768 / 1024² | floor img/s |
|---|---|---|---|---|---|---|---|
| v6e-1 | 918 | 1836 | 32 | 1638 | 560 | 49.7 / 163.7 / 164.4 | 20.1 / 6.1 / 6.1 |
notes: floor = FLOPs / peak, the roofline's
max(math, memory) with comms = 0; peaks, capacity,
bandwidth and ridge are the datasheet [S], the floors derived [D].
32 GiB holds all three components at once. DiT 7.75
GB + Qwen3-4B trunk 5.45 GB + VAE 99.2 MB = 13.30 GB of
weights [D] — 38.7 % of the chip's HBM. Measured: v6e-1
holds them with room — load_all took 35.9
s for 14.08 GB of weights and left
22.09 GB in use against a 33.55 GB device limit — 66 %
of capacity, 34 % still free [M].
| component | weights [D] | peak residency [M, L4] | v6e-1 (32 GiB) |
|---|---|---|---|
| DiT | 7.75 GB | 9.31 GiB | fits |
| Qwen3-4B trunk, 27 of 36 layers | 5.45 GB | 8.25 GiB | fits |
| all three resident | 13.30 GB | 17.56 GiB | 22.09 GB peak, 66 % of the limit |
These numbers are a lower bound, and that is a reporting
constraint, not a footnote. Colab's managed runtime reports
transparent hugepages as always [madvise] never [M] —
always is not set, and it is not ours to set; JAX warns
about exactly this on every run. Rule 7 follows: Colab for correctness
and iteration, a gcloud TPU VM for publishable
performance.
2. Correctness on a third backend
The port passes its ladder against PyTorch on a Modal L4: 16
rungs, 81 pass / 29 warn / 0 FAIL, end-to-end 33.3 dB
PSNR, mae 2.6 levels [M]. On TPU the ladder is a band
comparison, never a byte comparison: bf16 is not portable
across hosts, and any byte diff of a bf16 tensor across machines is
meaningless (docs/port-plan.md §6.4).
| rung group | L4 vs PyTorch [M] | requirement [S] | v6e-1 [M] |
|---|---|---|---|
| 1, 12, 16 (token ids, unpatchify, injected noise) | bit-exact | exact — a convention check has no dtype freedom | bit-exact |
| 2-11, 13-15 (per-layer to per-step tensors) | 27-77 dB; 159-181 dB on rung 7 | cosine > 0.99 and SNR ≥ 20 dB; 20-45 dB is the bf16 band | 26.18 dB minimum, 37 warns |
| end-to-end image | 33.3 dB PSNR, mae 2.6 | in-band PSNR, never byte-equal | 31.0 dB, mae 2.91 |
| totals | 81 / 29 / 0 | — | 73 / 37 / 0 |
notes: same captured noise, same prompt, same fixture; the only
moving parts are the codegen and the chip. Median per-key movement
against the L4 is +0.31 dB, with 64 of 98 finite-SNR
keys inside ±2 dB [M]. The eight extra warns are one localised shift and
not scatter: txt/hidden/7..15 sat just above the 45 dB line
on the L4 (45.0-46.7) and just below it on the TPU (41.0-41.9) [M]. The
per-layer injected checks agree between hosts to ±1.2 dB, so it
is accumulation through 27 Qwen3 layers, not a bad layer — which is the
whole reason the ladder injects the reference's inputs.
The finding worth taking away: an fp32 matmul on TPU is a bf16 matmul unless you raise the precision. Measured against float64, shape- and chip-independent [M]:
| precision | relative error vs fp64 | speed |
|---|---|---|
DEFAULT |
2.32-2.35e-3 (bf16-grade, 2⁻⁹) | 96 % of bf16 |
HIGHEST |
5.4-8.8e-8 (true fp32) | 13-15 % of bf16 |
The tell was the throughput — fp32 at 96 % of bf16 is impossible for
3-pass emulation — and it only surfaced by scoring the product against
float64 rather than trusting the declared dtype. It landed in the block
tests as a clean split: every fp32 row containing a matmul
collapsed (x_in 143.7 → 52.4 dB) while elementwise fp32
rows were untouched, which is why 4 of 10 tests failed at
DEFAULT and
jax_default_matmul_precision="highest" turns them into
10/10 with no bf16 row getting worse [M]. Two
reproduction notes: constant operands get host-folded and hide the
downgrade, so both must be jit arguments; and a degenerate
K=2 dot stays fp32, so one small probe misses it.
This reaches into the port itself. nn.sdpa upcasts q/k/v
to fp32 and computes both einsums in fp32 specifically to get
true fp32 accumulation. On TPU at DEFAULT, those einsums
run in bf16. It did not matter — the ladder is 0 FAIL either way and
dit/single/0/attn scores better on the TPU (47.2
dB) than on the L4 (42.7), because PyTorch's own SDPA is mixed-precision
— but "we wrote fp32 logits" was not a true statement about the
hardware.
3. Resident, staged, cold: three serving shapes
Residency is a product question, and it is the largest single effect measured here.
| shape | what one request pays | included | v6e-1 [M] |
|---|---|---|---|
| cold | first generate in the process |
staging + compile + compute | 61.2 s |
| staged | generate again, reloading 13.3 GB |
staging + compute | 35 735 ms |
| resident | load_all once, generate_resident
after |
compute | 262 ms |
notes: 512²; the other resolutions are in §4. Cold is never scored as an MFU: a number containing XLA compile is not a latency number.
The staged-minus-resident delta is 35.47 s per request at 512², 35.97 s at 1360×768 and 35.75 s at 1024² [M] — one image of maths against a 13.3 GB reload, a factor of 136×. So the same kernels serve at 3.8 images/s or at 0.028 images/s depending only on whether the chip can hold the weights.
Two honest qualifications. First, 35.9 s for 14.08 GB is 392 MB/s, a host-I/O rate rather than a device rate — the same bytes over PCIe at 10-25 GB/s is 0.5-1.3 s [D] and into HBM at 1638 GB/s it is 8 ms. The staged penalty is real on this VM and is a property of the storage path as much as of the chip; on a VM with the checkpoint in page cache the two shapes would sit far closer. Second, this is a batch-1 measurement: at 512² a resident v6e-1 spends 262 ms per image and could pipeline, so the honest framing is that residency converts a per-request I/O cost into a one-time one.
4. The measured latency budget
| stage | TFLOP [D] | floor ms [D] | v6e-1 ms [M] | %MFU [M] | compile s [M] | peak HBM [M] |
|---|---|---|---|---|---|---|
| GEMM calibration, 4096³ | — | — | 0.36 | 41.4 | 1.40 | — |
| text encode, S=512 | 2.909 | 3.2 | 104.8 | 3.02 | 2.72 | 7.58 GB |
| DiT 1 step, 512² | 10.191 | 11.1 | 58.3 | 19.05 | 4.25 | 14.95 GB |
| DiT 4-step scan, 512² | 40.763 | 44.4 | 158.1 | 28.08 | 4.45 | 14.95 GB |
| VAE decode, 512² | 1.994 | 2.2 | 14.4 | 15.06 | 11.24 | 14.96 GB |
| DiT 4-step scan, 1360×768 | 139.045 | 151.5 | 779.8 | 19.42 | 4.69 | 14.95 GB |
| VAE decode, 1360×768 | 8.355 | 9.1 | 42.9 | 21.23 | 15.54 | 14.96 GB |
| DiT 4-step scan, 1024² | 139.621 | 164.4 | 808.9 | 18.80 | 5.83 | 14.96 GB |
| resident request, 512² | 45.666 | 49.7 | 262 | 19.0 | — | 22.09 GB |
notes: measured ms excludes compile, the first post-compile call and
weight staging; every spread is under 8 % over 10 samples and the JSON
carries each one. The honest denominator is the calibration row, not the
datasheet: on the DiT scan v6e-1 reaches 28.1 % of
datasheet but 67.8 % of its own 4096³ rate [M]
— the datasheet peak is simply not reachable, even by a plain GEMM (41.4
%). Compile time is not proportional to FLOPs, the same inversion the L4
showed: the 2.0 TFLOP VAE costs 10-16 s of XLA and the 40.8 TFLOP DiT
costs 4.1-4.7 s [M]. The floor column is the
math term, FLOPs ÷ datasheet peak; §5.1 prices the
memory term too, and for one row it is the larger one.
The text encoder is the surprise. It is 6.4 % of a 512² image's FLOPs and it costs 104.8 ms of a 262 ms image on v6e-1 — 40 % of the wall clock — at 3.02 % of datasheet MFU, the worst module in the pipeline by a factor of five [D/M].
5. Predicted vs measured: the text-encoder prediction was wrong
The roofline's analytical model underestimates the L4 by 2.4-2.7× on
the DiT and 8.1× on the text encoder, decomposed there into an
m=1 prologue and small-shape inefficiency [M/D]. The
prediction was that the second mechanism shrinks on TPU,
because a TPU has no per-kernel host launch and XLA feeds the MXU
itself. Scored against each chip's own calibrated GEMM rate:
| stage | calibrated floor ms [D] | predicted factor [D] | measured factor [M] | verdict |
|---|---|---|---|---|
| DiT 4-step scan, 512² | 107.2 | 1.2-1.6× | 1.47× | holds |
| DiT 4-step scan, 1360×768 | 365.7 | 1.2-1.6× | 2.13× | above the band |
| VAE decode, 512² | 5.2 | 1.5-3.0× | 2.74× | holds |
| text encode, S=512 | 7.7 | 1.5-2.5× | 13.7× | falsified |
| end-to-end, 512² | 120 | 1.3-1.8× | 2.18× | dragged up by the text row |
notes: the calibrated floor is FLOPs ÷ the chip's measured 4096³ GEMM rate (380.1 TFLOP/s) [M], which is the only denominator that separates the model's error from the hardware's; the end-to-end factor is the measured resident request. The DiT and VAE predictions transferred to a different vendor and a different decade of hardware; the text encoder's did not, and it is worse on the TPU than the 8.1× the same model scored on the L4 [D].
So the mechanism the prediction rested on is not the mechanism that governs the text encoder. It is not established what does: the candidate explanations — a per-layer mix dominated by norms, rope and softmax rather than GEMMs; the fp32↔︎bf16 conversions §2 describes; the causal mask built inside the jit on every call — are hypotheses, and the falsifying measurement says the next instrument is per-layer differencing, not more modelling.
For reference against the published bars
(docs/benchmarks.md §A.2, which are 8-chip numbers): one
v6e-1 chip at 0.262 s for 512² is 2.4× the 8-chip target of
0.107 s at 31 % MFU — i.e. eight of these chips at the same
per-chip efficiency would beat the target by 3.3×. That is
arithmetic, not a measurement: §9 explains why it cannot be assumed.
5.1 The floor, module by module — the roofline's half of the same result
The tables above say where the gap is.
docs/roofline.md says what the floor is, row by
row: same chip, same graph, datasheet peak (918 TFLOP/s, 1638 GB/s),
floor = max(math, memory) per row [D], printed by
python3 tools/roofline.py all --chip v6e — the one-chip
version of its §8 hotspots.
| module, 512², 4 steps | floor ms [D] | % of peak [D] | binding [D] | the lever |
|---|---|---|---|---|
| ×20 single: linear1 | 22.74 | 100 | math | int8 — 988 AI, pure weight streaming |
| ×20 single: linear2 | 10.11 | 100 | math | already fused with the attention output, 946 AI |
| ×5 double: mlp | 6.11 | 93 | memory | int8 (1969 AI once the bytes halve) |
| ×20 single: qk-norm+rope | 3.69 | 0.2 | memory | fold rope + qk-norm into the qkv epilogue |
| ×27 text: mlp (SwiGLU) | 3.50 | 64 | memory | int8, or run once per prompt |
| ×20 single: attention | 2.55 | 100 | math | splash/Pallas for VMEM only, FLOPs unchanged |
| ×5 double: qkv | 1.89 | 100 | math | already one GEMM |
| ×20 single: norm+modulate | 1.84 | 0.2 | memory | fold into the preceding residual add |
| ×5 double: qk-norm+rope | 0.92 | 0.2 | memory | fold into the qkv epilogue |
| ×27 text: norm+qkv | 0.84 | 56 | memory | nothing above the floor |
| vae: up2 256×256 + upsample | 0.69 | 100 | math | nothing |
| modulation ×3 (shared) | 0.69 | 0.2 | memory | 283 MB of weights moved to produce 92 KB |
notes: rows are per-row maxima, so they sum above the pipeline's 49.7 ms — that figure is a single max over the whole graph (49.74 math against 49.33 memory, within 1 % of each other) [D]. Three readings fall out of it:
single: linear1alone is 46 % of the floor, and the two single-block linears are 66 % — the same 74 % of DiT FLOPs §8 quotes, now in milliseconds instead of share of work.- Seven of the twelve rows are memory-bound, and they are exactly the rows §8 item 3 prices: the four norm/rope/modulate rows in the DiT cost 6.9 ms, 14 % of the floor [D].
- The text trunk's floor is traffic, not arithmetic: 5.43 ms of unfused reads against 3.17 ms of math [D]. §4's floor column (3.2 ms) is the math term, and §5's calibrated floor (7.7 ms) raises that term at the chip's own measured 380.1 TFLOP/s but never touches the memory term. So the measured 104.8 ms is 19× the roofline floor — §5's 13.7× is the lenient reading of one finding, and §6 measures why directly: the MXU idles 85 % of that stage while the host dispatches.
6. Inside the path: where the time actually goes
jax.profiler traces of each stage, captured on v6e-1
with everything resident, one region per trace (the whole capture is 7.4
MiB, .xplane.pb included). The figures below are Perfetto
renders, cropped to their window and rebased to zero because Perfetto's
deep-link zoom does not take effect in headless Chromium.
These are XProf traces, not the JSON JAX writes for
Perfetto. jax.profiler.trace emits both a
perfetto_trace.json.gz and the .xplane.pb
files, and the xplane carries materially more — the DIT scan has
47 819 events against the native trace's 20 191, 709
distinct op names against 649, and, decisively, two tracks the native
file does not have: a Source code track
naming the Python line that issued each op, and a
Framework Name Scope track separating
jit(denoise) / while / body /
closed_call. It also labels /host:CPU and
/device:TPU:0 as separate processes, which is what turns
the host-versus-device question below from an inference into a
measurement. Converting is
xprof.convert.raw_to_tool_data.xspace_to_tool_data([xplane], "trace_viewer@", {})
— tools/xplane_to_perfetto.py wraps it.
Two numbers per stage matter, and they are not the same number.
Latency is the warmed median from
tools/bench_tpu.py. Device time is the
span of top-level ops on the trace's XLA Ops track — what the TPU was
actually executing. The gap between them is time the MXU was idle.
| stage | latency ms [M] | device-op ms [M] | floor ms [D] | device / latency | latency / floor | %MFU datasheet [M] |
|---|---|---|---|---|---|---|
| text encode, S=512 | 104.8 | 16.1 | 7.7 | 15 % | 13.7× | 3.0 |
| DiT 4-step scan, 512² | 158.1 | 130.1 | 107.2 | 82 % | 1.47× | 28.1 |
| VAE decode, 512² | 14.4 | 9.7 | 5.2 | 67 % | 2.74× | 15.1 |
| whole request | 262 | — | 120.1 | — | 2.18× | 19.0 |
notes: the floor is FLOPs ÷ the chip's own measured 4096³ GEMM rate
(380.1 TFLOP/s), not the datasheet [D]; device-op spans are from the XLA
Ops track of each region's trace, divided by the traced iteration count
[M]; %MFU datasheet is FLOPs ÷ 918 TFLOP/s ÷ the warmed
latency [M]. Latency excludes compile and weight staging. The
whole-request device figure is omitted because the three stages were
traced separately and their host overheads do not sum cleanly.
The DiT is textbook proportioned. Per step, the
20-block single stack takes 25.57 ms and the 5-block
double stack 6.71 ms — 79 % / 21 % of the scan, against
a FLOP split of 80 % / 20 % [8125 vs 2031 GFLOP, D]. Time tracks FLOPs
almost exactly, which is what a compute-bound region with no dominant
sub-module looks like: 1.28 ms per single block, 1.34 ms per double
block, and the double block carries twice the parameters. There is no
module-level anomaly to chase here. The largest single op in the whole
DiT is fusion.319 at 62.5 ms over 160
instances (2 iterations × 4 steps × 20 blocks) — the
single-block's fused GEMM chain, 0.39 ms each [M].
How much of the wall clock is the TPU actually working? Taking the union of top-level spans per process in the XProf trace gives the device's busy time directly. Set against the un-profiled latency from the harness — the profiler inflates wall time, so device busy over traced time would understate occupancy:
| region | device busy ms [M] | latency ms [M] | device occupancy | idle |
|---|---|---|---|---|
| text encode | 16.0 | 104.8 | 15 % | 85 % |
| DiT 4-step scan | 131.1 | 158.1 | 83 % | 17 % |
| VAE decode | 8.0 | 14.4 | 56 % | 44 % |
| whole request | 155.3 | 262 | 59 % | 41 % |
The device figures agree with the XLA-Ops method above to within a millisecond (16.1 vs 16.0, 130.1 vs 131.1), from an independent part of the trace. So on a fully resident v6e-1 the MXU works for 155 ms of a 262 ms request and is idle for the other 107 ms — and 85 % of the text-encoder stage is idle, which is where nearly all of that 107 ms lives. The host-side busy time from the same trace is not quoted here: it is inflated by the profiler (the traced request takes 906 ms against 262 ms un-profiled, 3.5×), so it is a relative signal, not a budget.
And the source-line track names the lines. Self time
on the Source code track, DiT scan:
| line | what it is | self ms [M] | calls |
|---|---|---|---|
sampling.py:52 |
the Euler lax.scan (contains the block scans) |
260.25 | 26 |
dit.py:65 |
the 20-block single_blocks scan |
204.71 | 328 |
nn.py:20 |
return x @ w — every linear |
112.16 | 690 |
dit.py:56 |
the 5-block double_blocks scan |
61.56 | 2 736 |
nn.py:65 / nn.py:61 |
attention PV / QKᵀ einsums |
60.33 | 200 |
rope.py:47 |
the fp32→bf16 rope rotation | 16.02 | 840 |
notes: sampling.py:52 contains the two block scans, so
these nest; the 200 attention calls are 2 iterations × 4 steps × 25
blocks, and the 690 linears are the projections and MLPs inside them.
For the text encoder the same track gives nn.py:20 at
10.66 ms over 270 calls (27 layers × 10 linears) and
the three trunk scans at 32.7 ms — so of the whole
27-layer trunk, the projections and MLPs are 10.7 ms and everything else
is normalisation, rope and attention.
The text encoder is the anomaly, and it is not the
arithmetic. It is 6.4 % of the image's FLOPs and 40 % of its
wall clock, and only 15 % of its latency is device-op
time [M]. Its 27 layers occupy 14.5 ms of
device time; ops that run once per call — the embedding gather,
the RoPE tables, the causal mask, the tap concatenation — occupy
14.2 ms, as much as all 27 layers combined [M]. The
remaining ~89 ms of its 104.8 ms is host-side: the trace window is
filled with H2D Dispatch / XlaLinearize /
Linearize bands on the host threads, not with device
work.
That is a different failure than the one predicted in §4. On a GPU the text encoder's problem was small-shape GEMM inefficiency; on TPU it is that the MXU sits idle while the host feeds it. Both produce the same symptom — a 13.7× gap to the calibrated floor — and the fix is the same shape: fewer, larger device ops. Concretely, the ~14 ms of once-per-call prologue is nearly free to remove (build the RoPE tables and the mask once, outside the traced region, and skip re-deriving them per prompt), and the 27-layer trunk is already a scan.
The VAE is the opposite: 67 % device-op time, a flat sequence of ~870 small fusions with the largest at 1.1 ms, and a 2.74× gap [M]. It is small (5.5 % of the image), near its own floor, and not worth optimizing.
MFU, end to end and per component. The whole 512² request runs at 19.0 % of the v6e-1 datasheet (174.3 TFLOP/s) and 45.9 % of what this chip actually achieves on a 4096³ GEMM [D/M]. Per component, against the same two denominators: DiT 28.1 % / 67.8 %, VAE 15.1 % / 36.4 %, text encoder 3.0 % / 7.3 %.
The traces
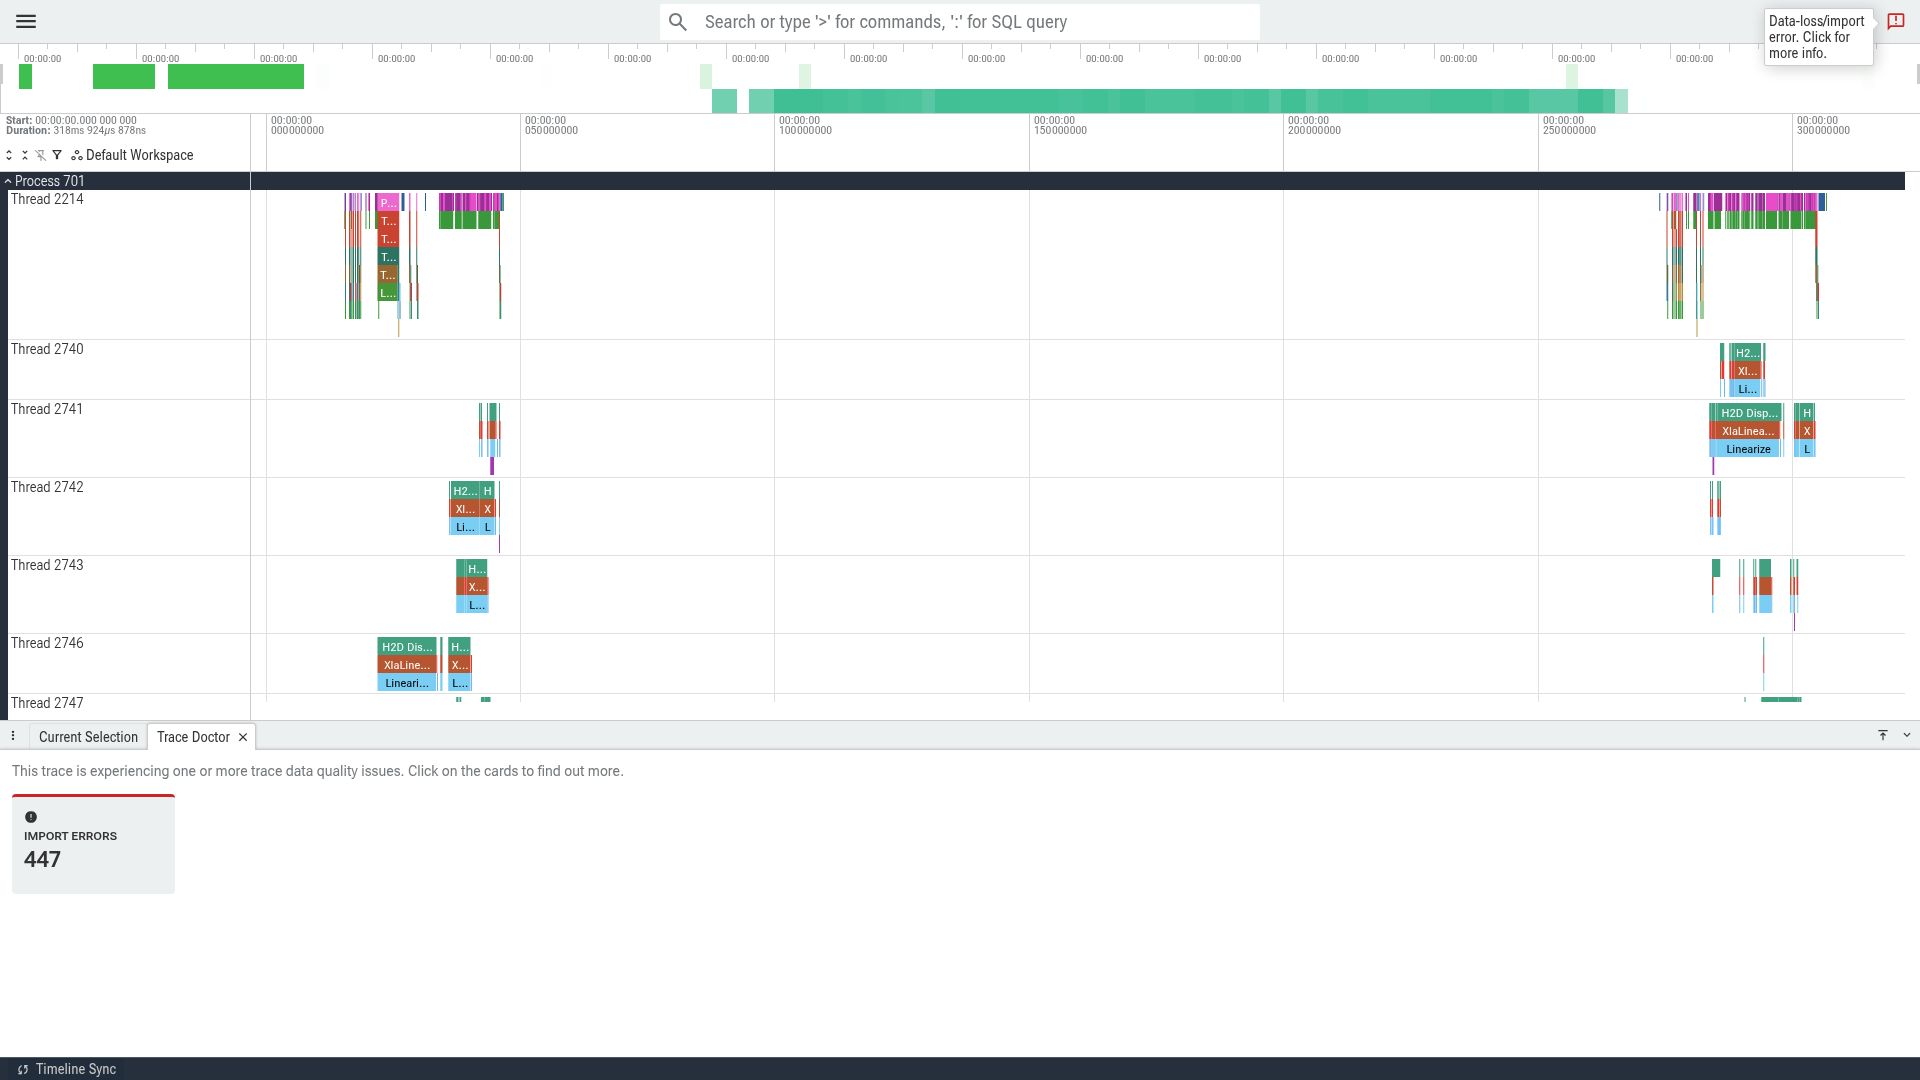
The whole 512² request with everything resident.
Process 3 carries the XLA op launches; the wide teal band
is the 4-step DiT scan, and the green blocks are the text encoder and
VAE either side of it. Duration 318 ms for two traced iterations.
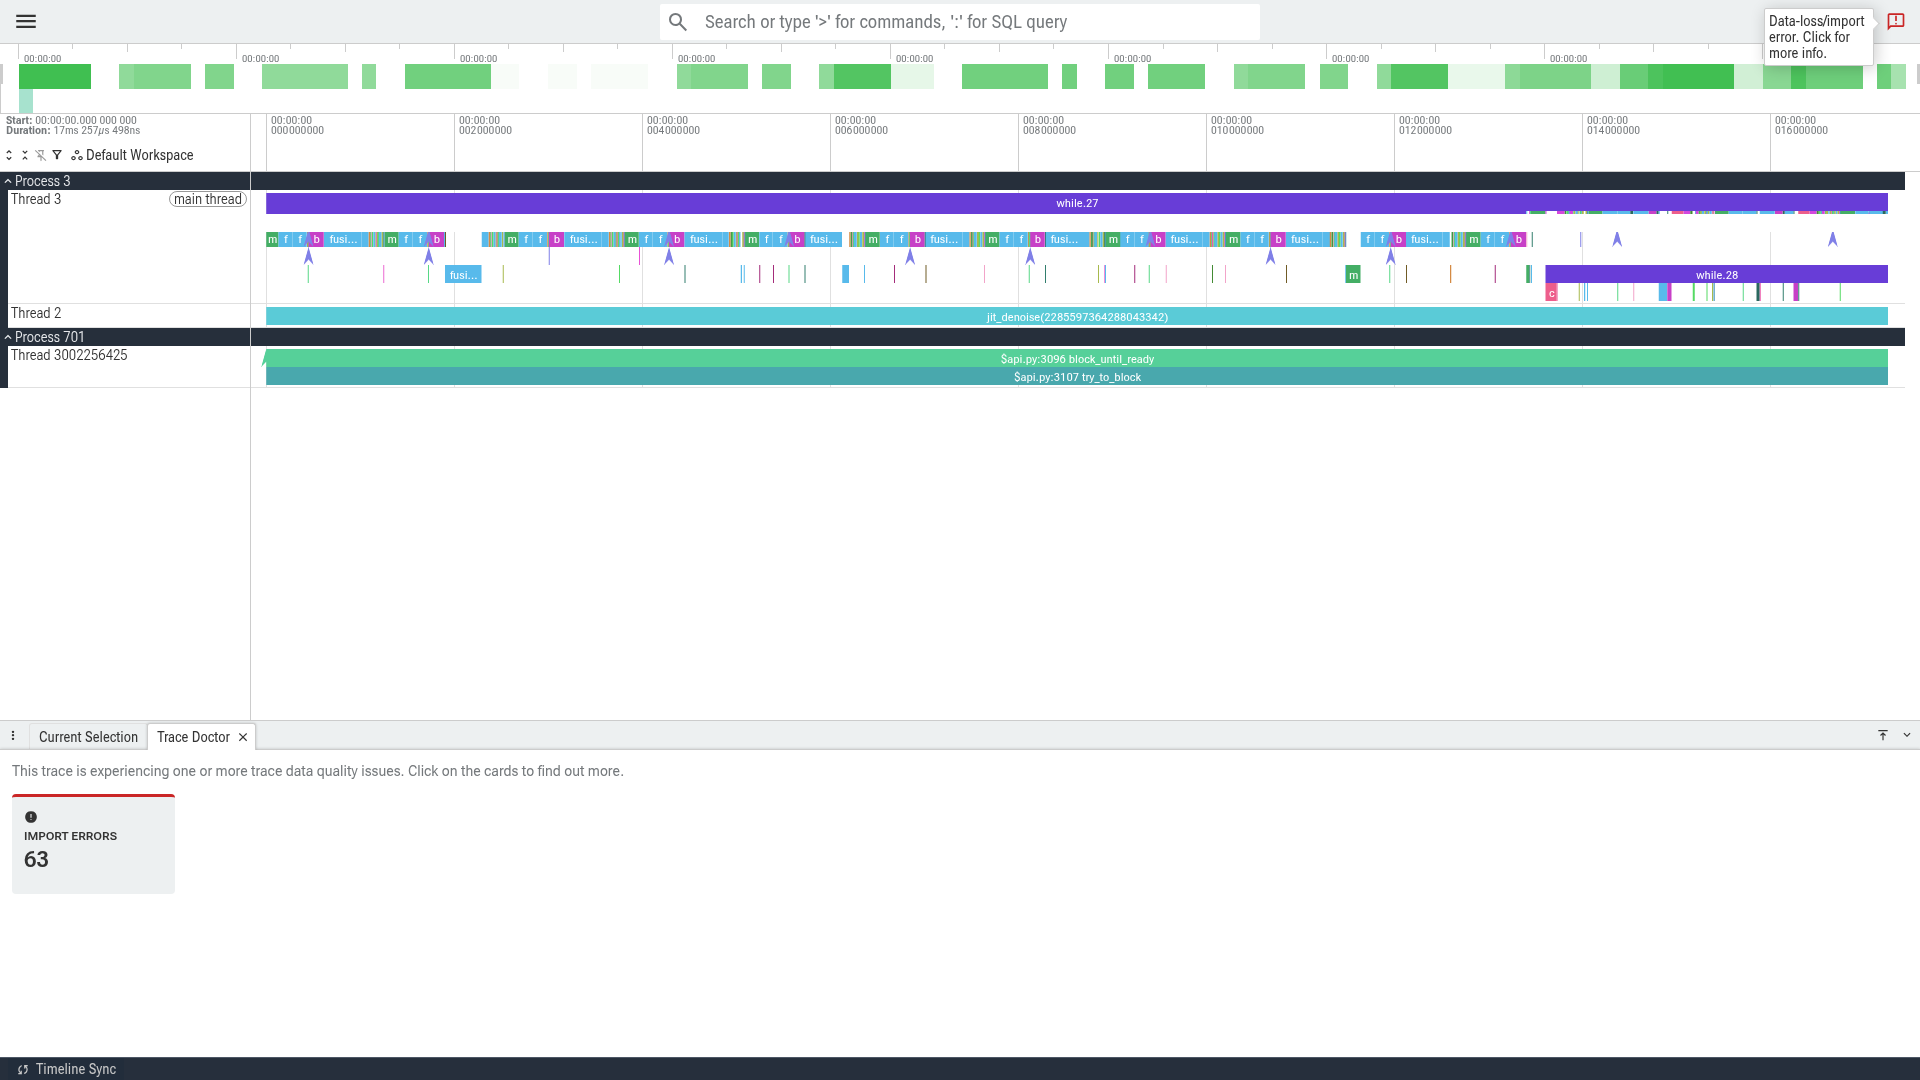
The 4-step scan in detail: while.27 is the Euler scan,
while.29 the 20-block single stack inside each step,
while.28 the 5-block double stack, and the individual
fusion slices between them are the per-block GEMM
chains.
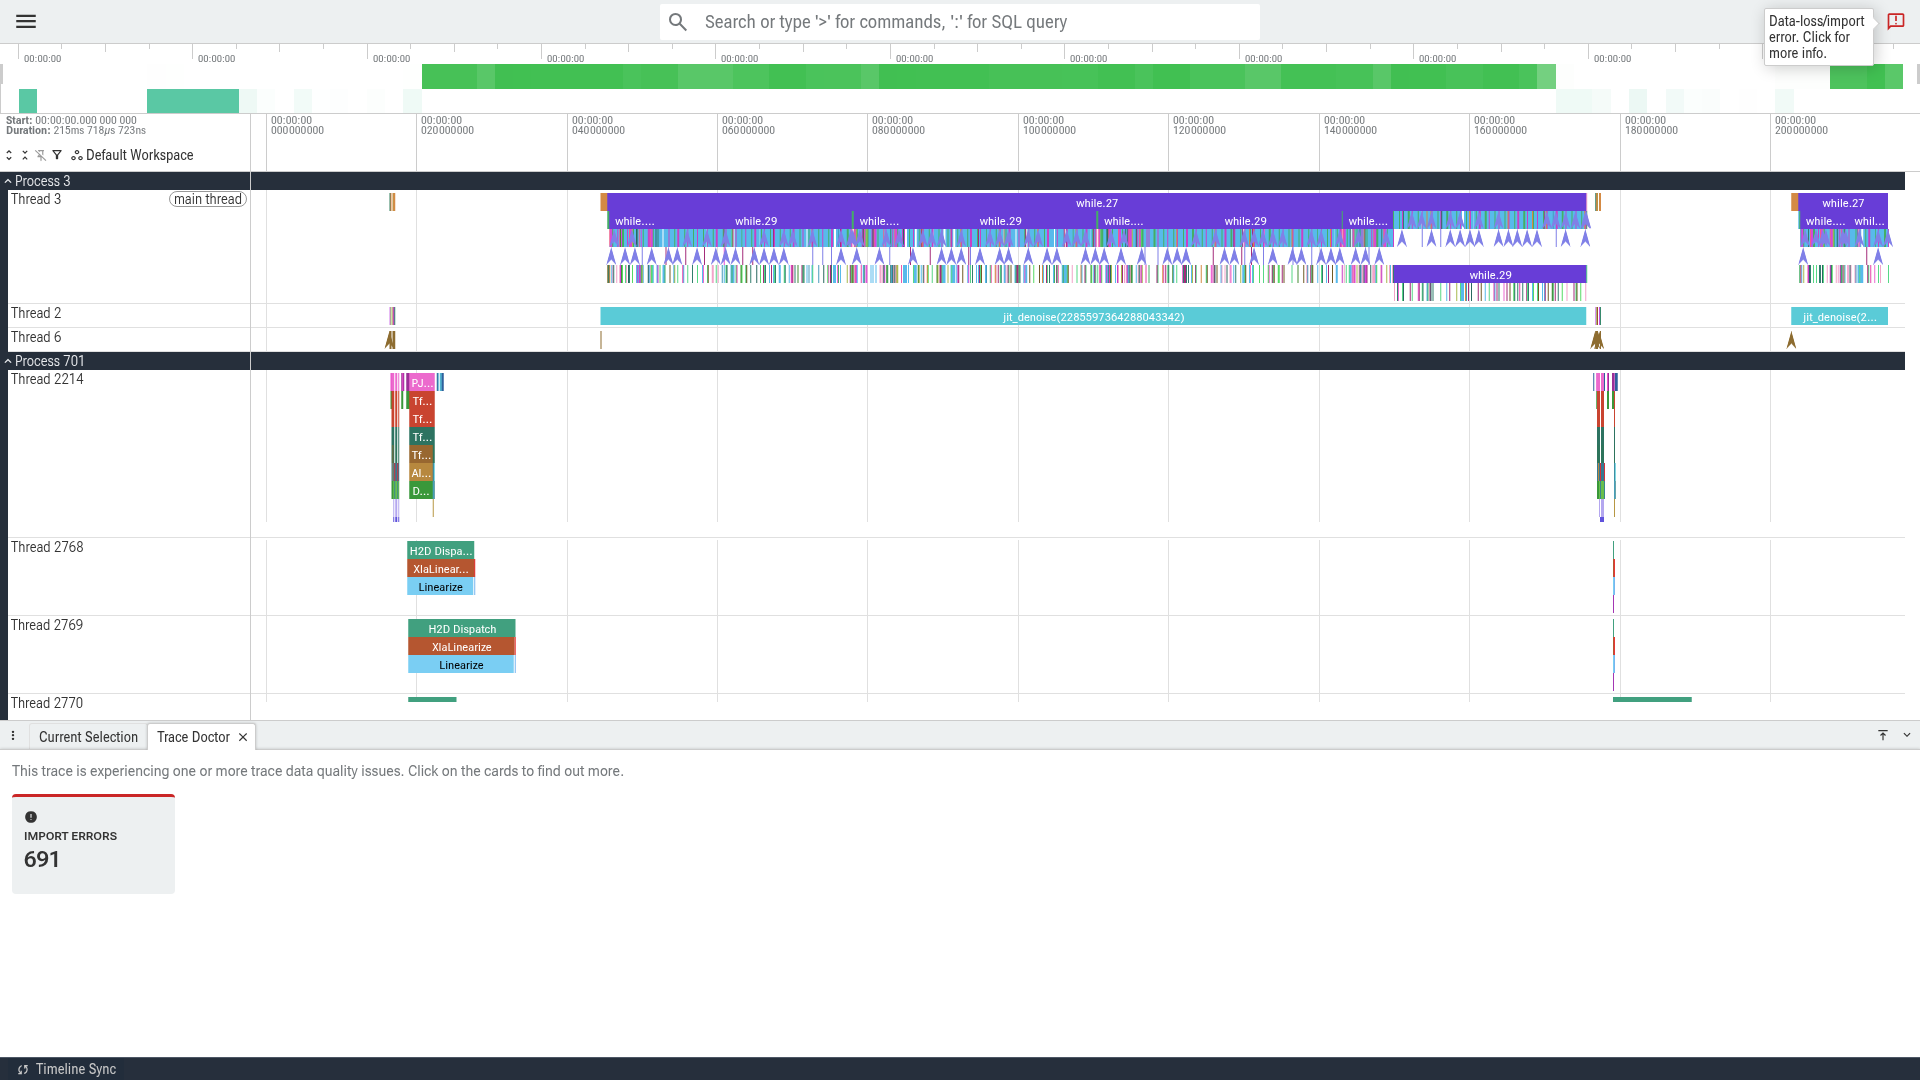
A wider window over the same trace, showing how regularly the blocks repeat — 20 single and 5 double per step, at constant width.
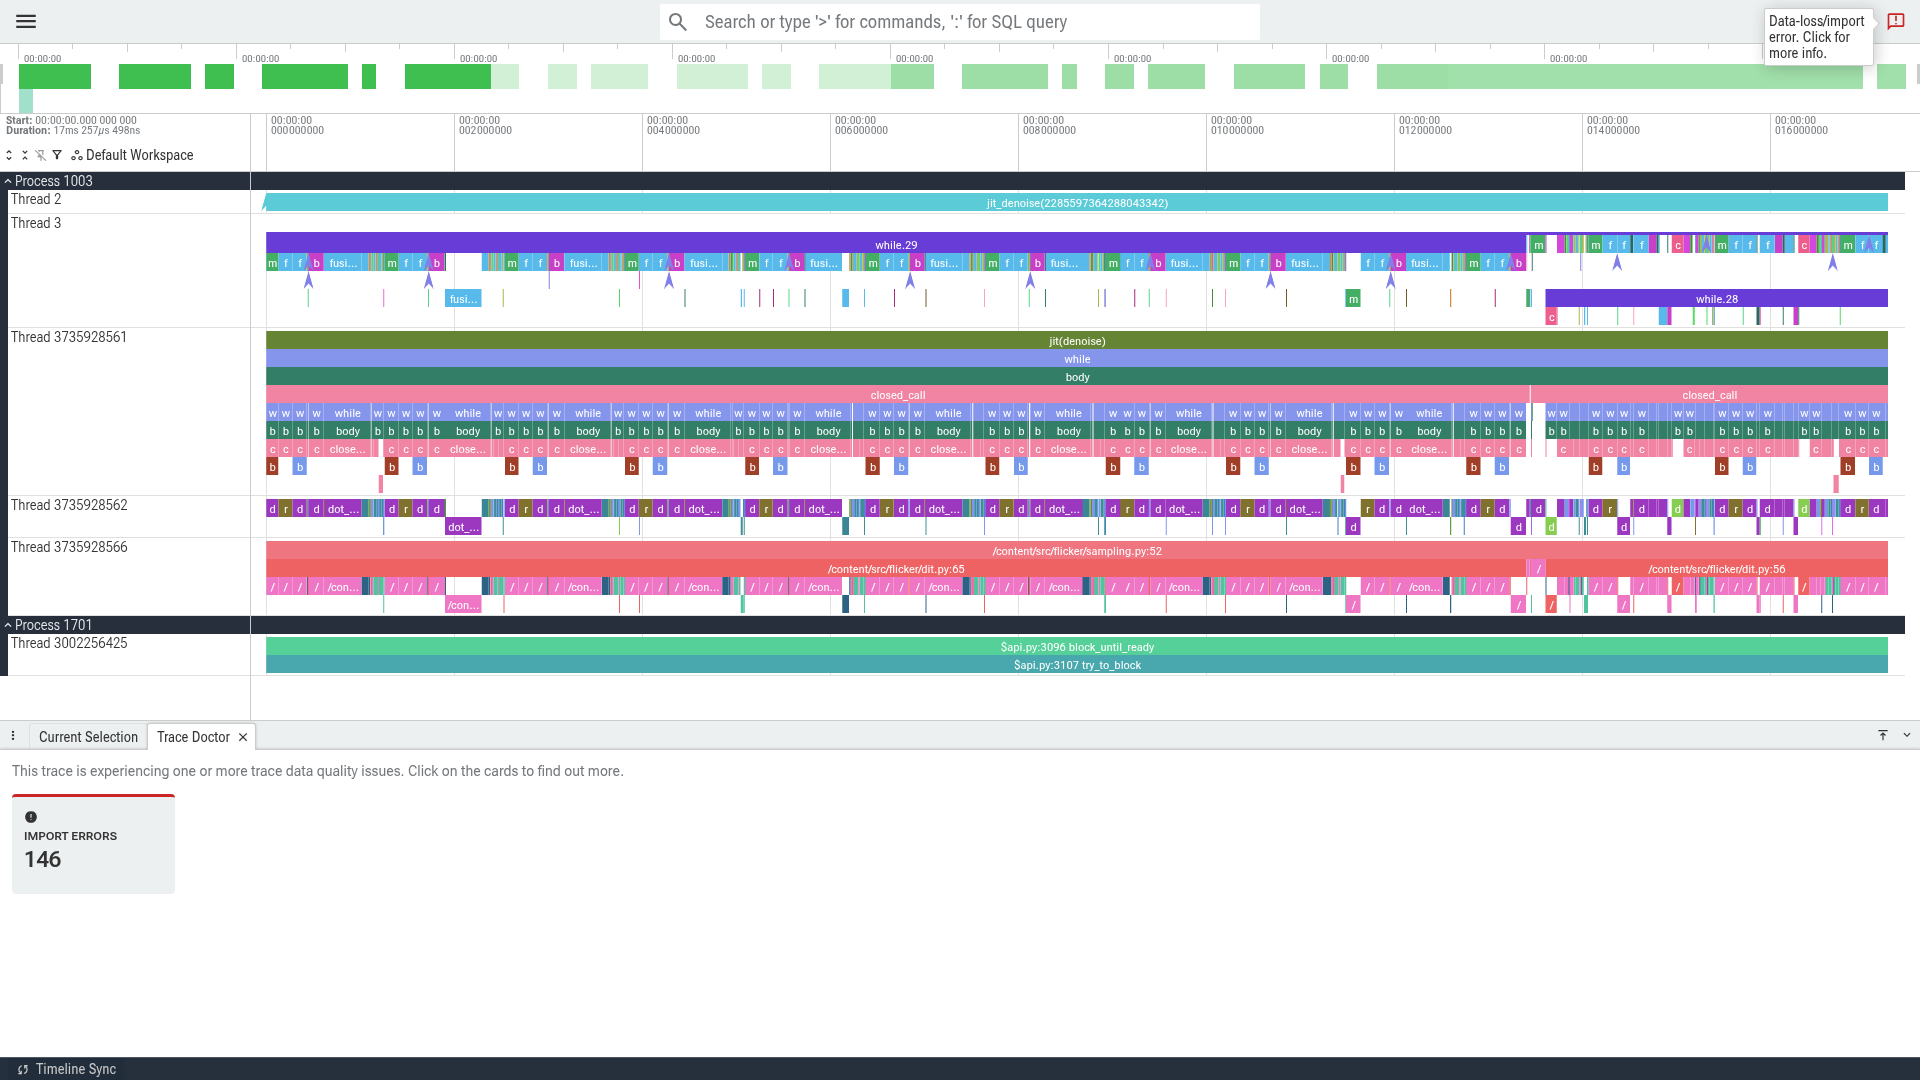
The same 17 ms window again, from the XProf capture.
Three things appear that the native trace does not have: a
Source code track carrying
/content/src/flicker/sampling.py:52 and
dit.py:65, a Framework Name Scope track
showing jit(denoise) → while →
body → closed_call, and
/device:TPU:0 and /host:CPU as separate
processes — which is what makes the busy-time table above a measurement
rather than an inference.
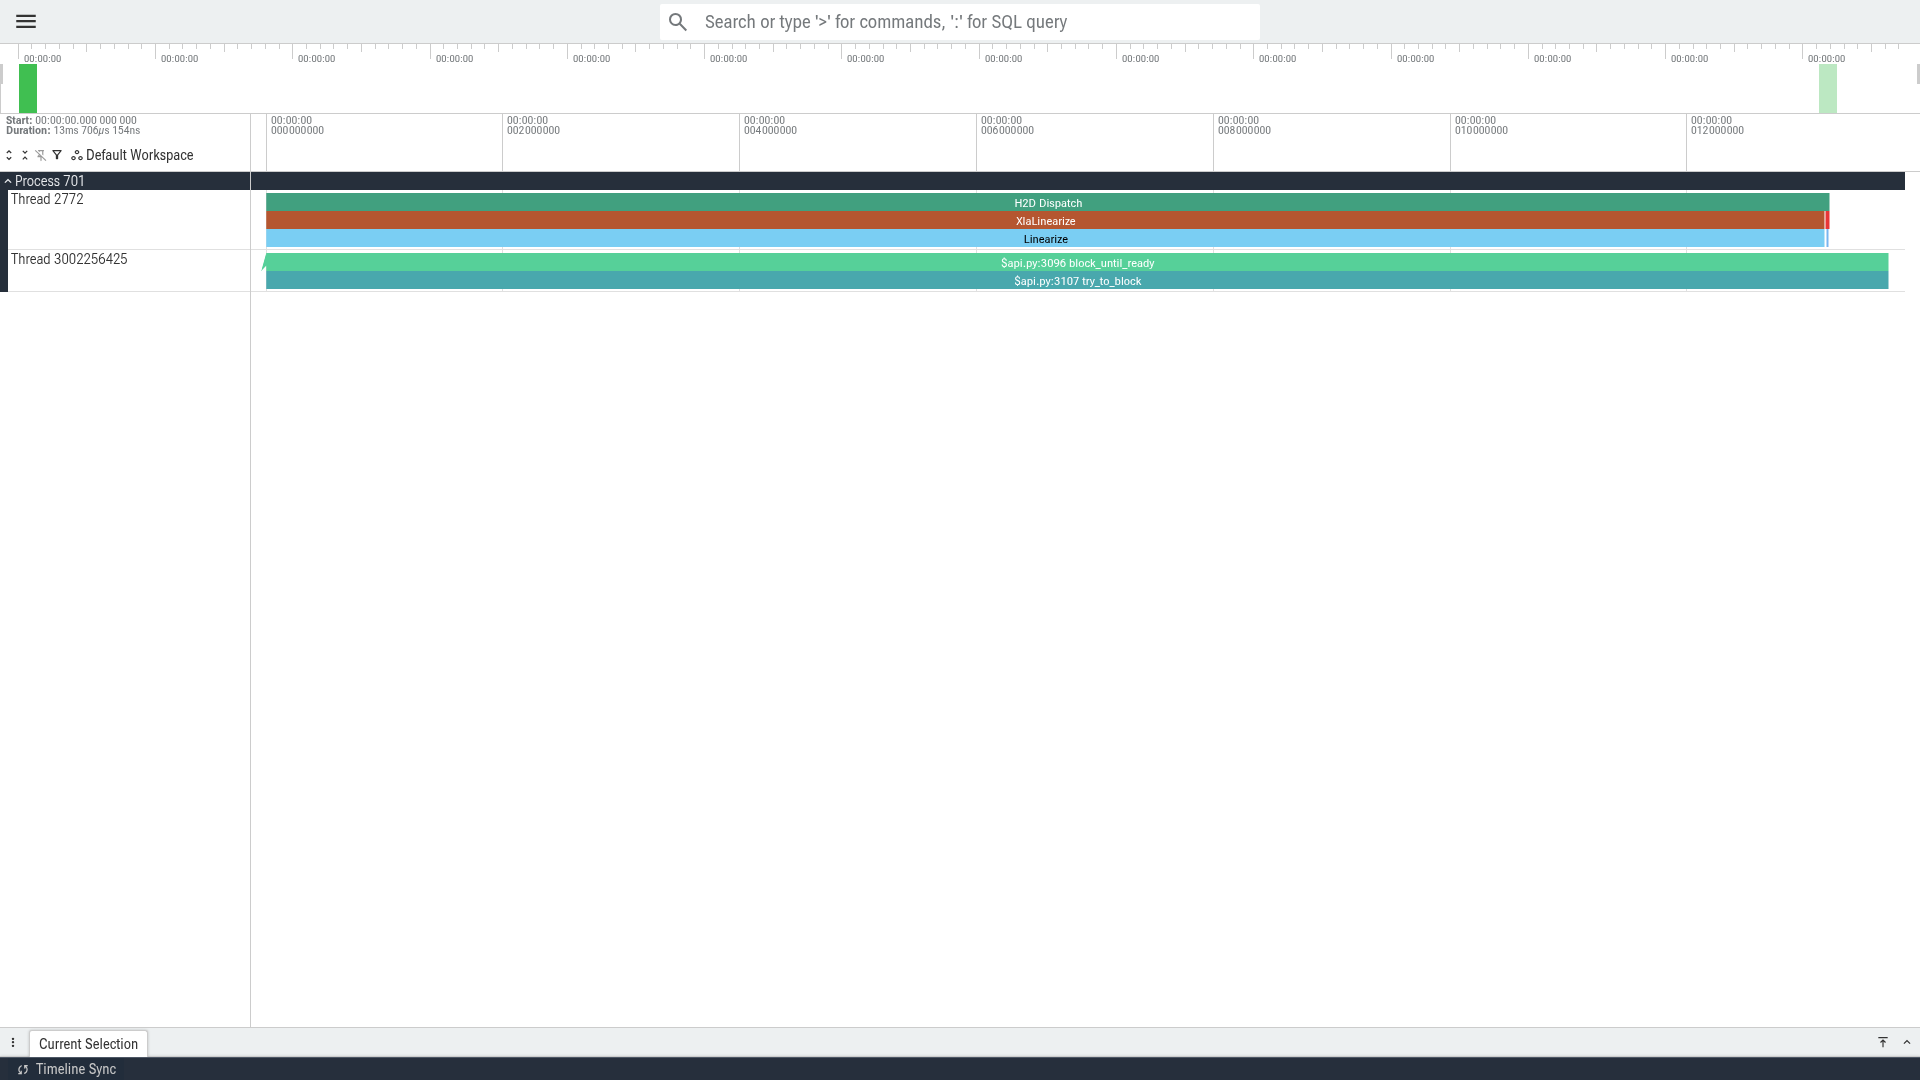
The text encoder. This is the finding in one picture: the window is
entirely host dispatch machinery —
H2D Dispatch, XlaLinearize,
Linearize — wrapped around block_until_ready.
The device work it is feeding is the thin band at the top.
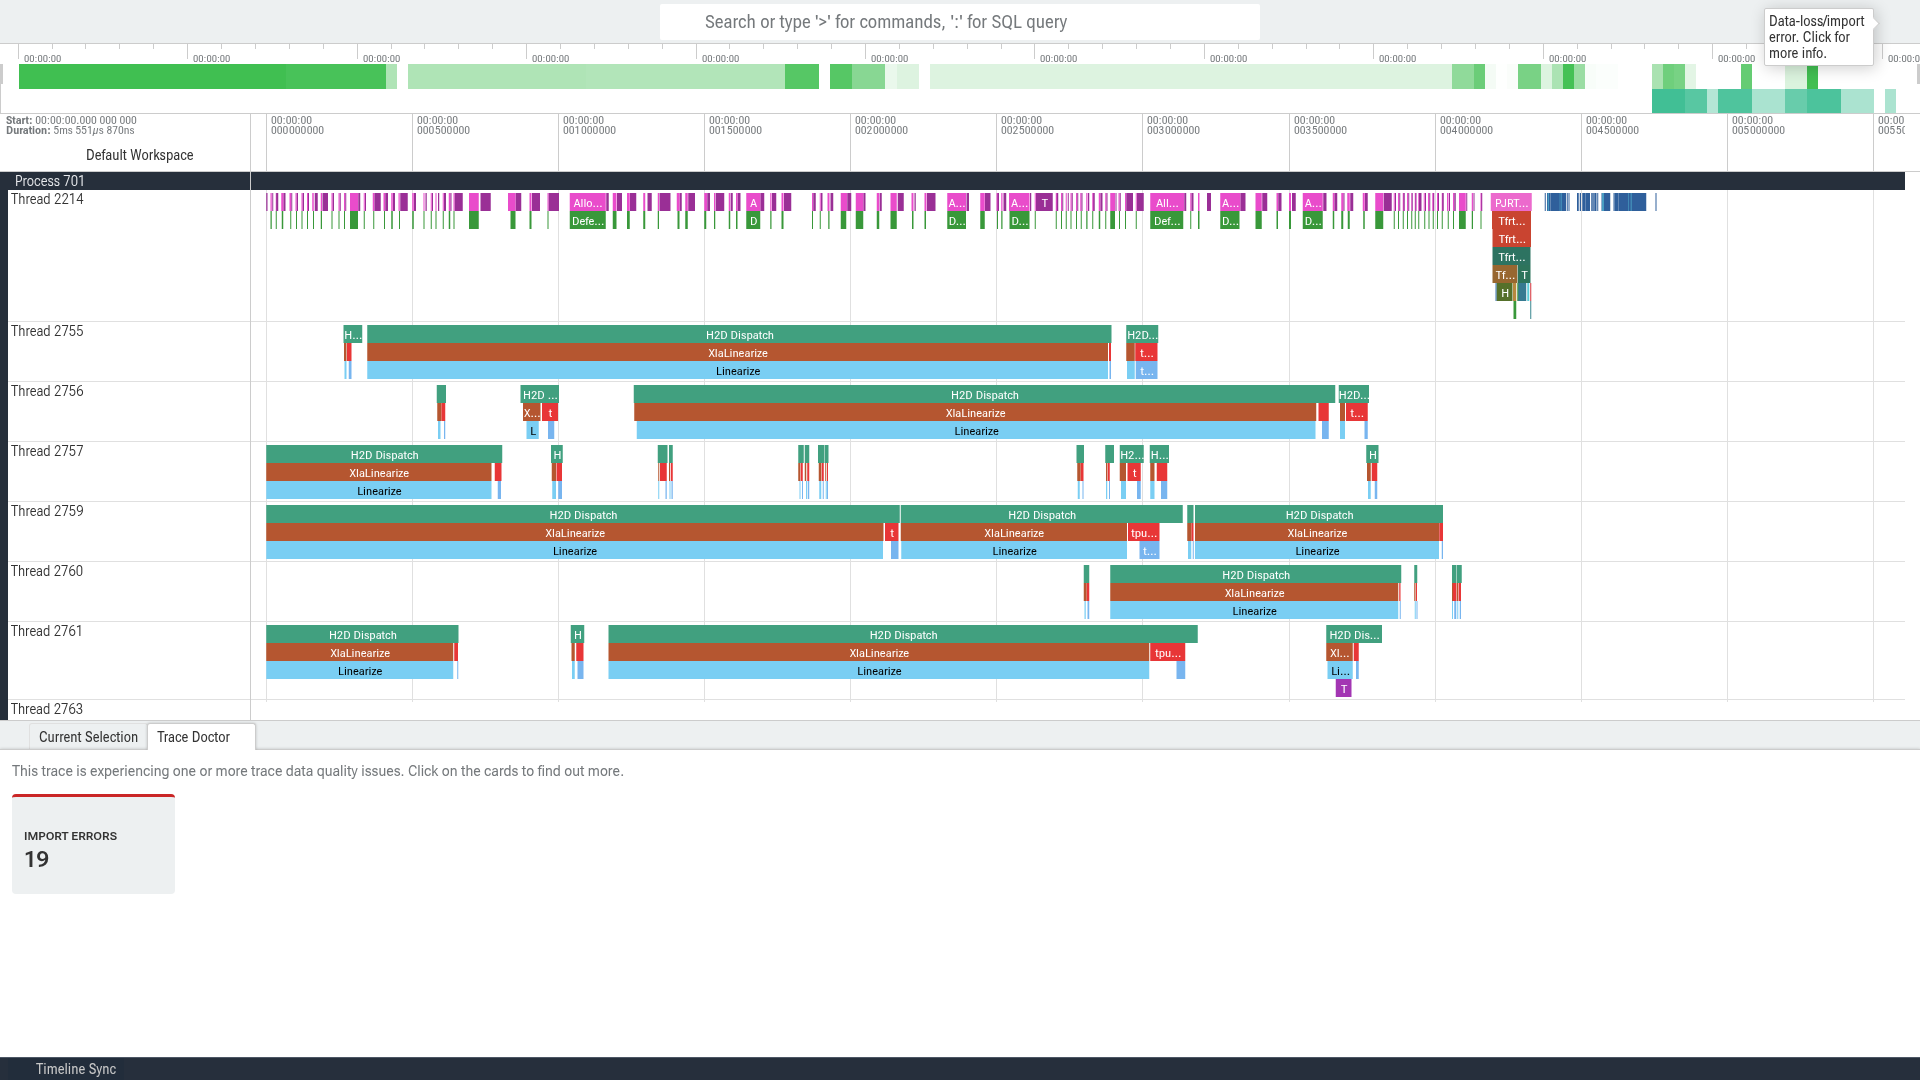
The VAE decoder, by contrast: approximately 870 small ops, individually visible, tightly packed.
Why the traces were re-derived
The first version of this section used the
perfetto_trace.json.gz files directly, because they open in
Perfetto with no conversion. They are a lossy view: they carry the op
names but not the Python frame that issued them, and they flatten host
and device into one process. Converting the .xplane.pb
alongside them cost one local command and produced the source-line table
and the busy times above, so the figures and the attribution here are
from the XProf traces. The two agree where they overlap, which is the
useful part: the device-op spans and the device busy time were computed
from different tracks and land within a millisecond.
Two caveats on every number in this section. The
profiler inflates wall time — the traced full_resident
iteration measured 421 ms against the harness's 262 ms — so the traces
are used for structure and relative attribution, never for
latency; every millisecond quoted above comes from the bench harness.
And XLA records a while op and the ops inside its
body, so the tracks nest: summing every row of a trace double-counts,
which is why the table uses top-level spans and says so.
7. The same GPU, both backends
§6 says where the time goes on the TPU; it cannot say whether the
port itself is the problem. So both backends were run on one
L4 (22.03 GiB, one container per framework — JAX does
not hand GPU memory back after clear_caches(), and torch's
weight load OOM'd against the 22.01 of 22.03 GiB the first half was
still holding), each fed the captured fixture's own inputs
(sample/x0, txt/ctx, the step-3 latent). Same
weights on both sides (dit.safetensors — the reference's
own file — and the diffusers VAE), two warmups, median of ten
device-synchronised calls, compile excluded.
| stage, 512² | JAX L4 [M] | BFL torch L4 [M] | torch / JAX | JAX v6e-1 [M] | v6e-1 vs torch-L4 |
|---|---|---|---|---|---|
| devices on this row | Modal L4, 22.03 GiB | Modal L4, 22.03 GiB | — | Colab v6e-1, 32 GiB | — |
| one DiT step | 366.7 | 253.8 | 0.69× | 58.3 | 4.4× |
| DiT, 4 steps | 1385.1 | 1021.0 | 0.74× | 158.1 | 6.5× |
| VAE decode | 145.8 | 98.1 | 0.67× | 14.4 | 6.8× |
| parity vs golden, u8 mae | 0.94 | 0.00 | — | 0.09 | — |
On a GPU, XLA is behind eager torch at these shapes, and by a consistent margin. The reference's denoise is 1.36× faster end to end and its decoder 1.49× — the same factor in two structurally unrelated graphs, a 25-block attention stack and a conv decoder. That points at codegen rather than at a bug, and the parity column agrees: this port's image is 0.94 u8 levels from the reference image on the same device, while the reference reproduces its own capture bit-exactly by construction. On the TPU the same comparison inverts.
Against the L4 the TPU port wins by 6.5× on the DiT and 6.8× on the VAE — the L4 is a 22.03 GiB card, the chip a 32 GiB one, so this is also a larger-faster-against-smaller-slower trade. The same JAX code on the L4 is 8.8× and 10.1× slower, while the two chips' measured GEMM rates differ by only 4.7× (80.6 vs 380.1 TFLOP/s) [M] — the port extracts ~1.9× more of the accelerator ratio than the FLOP ratio predicts. The datasheet tells the opposite story, and both are true [S]:
| L4 (121 TFLOP/s) datasheet | L4 measured (80.6) | v6e-1 (918) datasheet | v6e-1 measured (380.1) | |
|---|---|---|---|---|
| JAX DiT 4-step | 24.3 % | 36.5 % | 28.1 % | 67.8 % |
| BFL torch DiT 4-step | 33.0 % | 49.6 % | — | — |
| JAX VAE | 11.2 % | 16.8 % | 15.1 % | 36.4 % |
| BFL torch VAE | 16.6 % | 25.0 % | — | — |
Against their published peaks the L4 numbers are the better ones, and the reason is §1's: this v6e delivers only 41.4 % of its datasheet on a 4096³ GEMM, so a fraction-of-datasheet comparison flatters any accelerator whose peak is reachable. Against what each chip demonstrably achieves, the TPU port is 1.9-2.2× closer to its own roofline than the reference is to the L4's — which is the honest statement of where the port stands.
The text encoder is deliberately absent from this
table (§2): the reference loads Qwen/Qwen3-4B-FP8
and this port runs 27 of Qwen3's 36 layers from the klein bf16 shards,
so there is no same-input text comparison to run. The cross-check that
the protocol is sound is internal: this harness measures four dispatched
DiT steps at 1466.8 ms against the scan's 1385.1 ms — the same 1.06×
that the earlier L4 run reported [M].
8. What to optimize next
- The text encoder, before anything else — and §6 now says which part. 40 % of the wall clock for 6.4 % of the FLOPs at 3.0 % MFU, and only 15 % of its latency is device-op time. Half of that device time is ops that run once per call — RoPE tables, the causal mask, the embedding gather, the tap concat — which is 14.2 ms of the 104.8 ms and is nearly free to hoist. The other half is the 27-layer trunk in 14.5 ms. Whatever the remaining ~89 ms of host-side time is, it is the single largest recoverable block in the pipeline.
- int8 on the four big GEMM stacks.
single: linear1andlinear2are 74 % of DiT FLOPs [D]; they sit at unfused AI 522-864 against the 560 ridge [D], so doubling the rate is legitimate where a row is math-bound. The roofline prices the saving at 6.6 ms of the 49.7 ms 512² floor (13 %) and 33.8 ms of the 163.7 ms floor at 1360×768 (21 %) [D] — the fraction is well under a pure FLOP halving becausedouble: mlp(AI 522) is memory-bound too, which is exactly the correction the ridge point predicts (§5.1 prices it in milliseconds). v6e's fp8 is not the alternative: it publishes the same rate as bf16, the signature of emulation [S]. - Fuse the norm, rope and modulate rows. The four
such rows in the DiT cost 6.9 ms of the 49.7 ms 512² floor (14
%) [D] — a larger share than a lower-ridge part would pay,
because their traffic is fixed while the compute peak is not. All twelve
module floors are in §5.1, which also shows why: seven of the twelve are
memory-bound, and
linear1alone is 46 % of the floor. - splash/Pallas only at long sequences. Attention is 7.2 % of DiT FLOPs at 512² but 18.8 % at 1360×768 [D]; the reason to care is VMEM, not FLOPs. At 512² it buys nothing.
- Leave the VAE and the sampler alone. The decoder is 4.4 % of 512² FLOPs, and four steps is already distilled — the caching literature's 1.3-2× came from 28-50-step baselines [S].
- Do not chase dispatch overhead.
lax.scanalready beat four dispatched forwards by 1.057× on the L4 [M], and here it is 1.48× faster per step than a single dispatched step (158.1 ms for four against 58.3 ms for one) [M].
9. What this does not establish
Nothing about the 8-chip layout question. One single chip cannot see a collective: FSDP-8's all-gather is 6.78 GB per chip and 16.96 ms per image at 8 chips, Ulysses is 0.26 ms, TP is 1.45 ms [D] — enough to move the same 512² floor from 6.48 ms (96 % of peak) to 23.17 (27 %). The ranking that follows — shard between requests, not within one — is a claim about ICI that this run does not test.
Nothing publishable as a performance figure. Colab
is a managed, shared, ephemeral runtime where transparent hugepages
cannot be set (rule 7), so every latency above is a lower
bound; the published configuration is the same harness on a
gcloud v6e-1 spot VM ($0.243/chip-hour in
europe-west4-a [S]), which needs no code change.
Nothing about the 9B. These are 4B numbers; the 9B has 8 double and 24 single blocks at hidden 4096 and does not fit the same envelope.
What it does establish: the first TPU latency, MFU, per-stage profiler attribution and residency measurements for FLUX.2 klein-4B anywhere — no published TPU number for this model exists, from any source — plus four transferable results: an fp32 matmul on TPU is bf16 unless asked otherwise; a single 32 GiB chip serves this model resident at 262 ms using 66 % of its HBM; the analytical model that predicted the DiT and the VAE to within 1.4-2.7× was wrong by 5× about the text encoder; and the profiler attribution that localises it, with the DiT shown to be proportioned exactly to its FLOPs (79 % of scan time against 80 % of scan FLOPs) and the text encoder's MXU idle for 85 % of its latency. §5.1 gives that finding its other half: the model's per-module floor for the same graph.
Where the numbers come from
tools/bench_tpu.py --chip v6e1 --stages cold,staged,resident
and then --stages calib,text,dit,vae, one JSON object per
run on stdout, ten samples per stage; correctness from
tools/tpu_correctness.py; the L4 head-to-head from
tools/bench_backends.py (one Modal app, two L4
functions, out/bench/backends.json). The runs are
out/bench/*.json and out/tpu/*.json, the
transport is the private dataset tensorkelechi/flicker-tpu,
and the full bring-up log with every command is
docs/tpu-bringup.md. Colab shipped jax
0.7.2 against the 0.11.2 this port is developed on, and the
port needed no change [M].
One operational note that is worth more than it looks: keep
one session, tear it down at the end. The measurements here
took ~14 separate colab run invocations, each of which
booted a fresh VM, re-installed jax and re-downloaded the 15.97 GB
checkpoint before doing any work — ~91 minutes of VM lifetime for about
four minutes of actual compute. colab run self-cleans,
which is why nothing was ever orphaned, and that safety is exactly what
the provisioning costs. For an iterative phase,
colab new -s <name> once and
colab exec -s <name> -f script.py per step pays it
once.